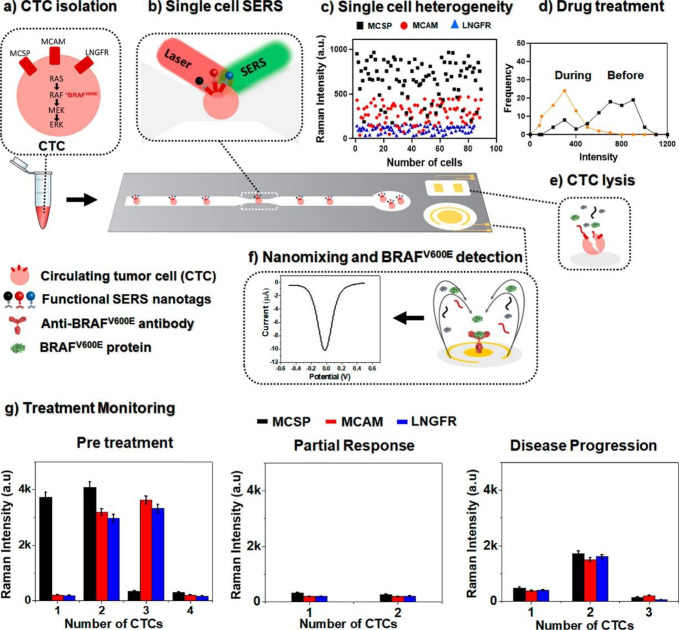
Figure 52.
Graphical representation of the platform combining microfluidics, SERS, and electrochemistry for the analysis of CTC heterogeneity during treatment. See text for more details. Adapted with permission from ref (508). Copyright 2021 American Chemical Society.

