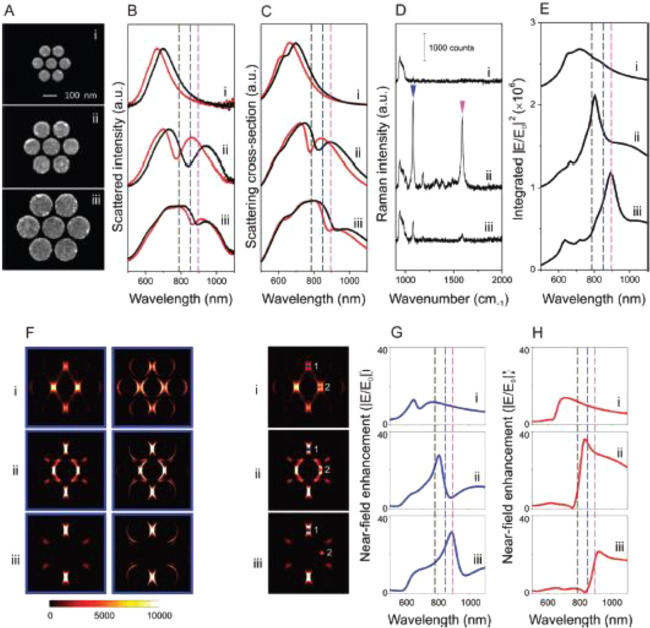
Figure 8.
Far-field scattering spectra, near-field enhancement spectra, and SERS properties of individual heptamers with varying sizes: (i) 85-, (ii) 130-, and (iii) 170 nm-diameter constituent disks. In all structures, the height of the disks is 30 nm and the gaps between the disks are ∼15 nm. (A) SEM images, (B) experimentally obtained dark-field scattering spectra, (C) FDTD-calculated scattering spectra, and (D) SERS spectra of a monolayer of para-mercaptoaniline (p-MA) molecules for the individual heptamers (i–iii) obtained with horizontal polarization. In panels B and C, the scattering spectra of the individual heptamers exhibit a significant red shift with chemisorption of a monolayer of p-MA molecules. Pristine structure (red) after p-MA binding (black). (E) Total near-field enhancement intensity (|E/E0|2) spectra calculated by integrating over all surfaces of the heptamer. (F) Spatial distribution of the SERS enhancement (=|Eex/E0|2 · |Estokes/E0|2) for the p-MA Stokes line at 1080 cm–1 for each of the individual heptamers (i–iii). Enhancement evaluated at half the height (left) and 2 nm above the top surface (right) of the cluster. (G, H) Calculated near-field enhancement (|E/E0|) spectra at HSs (G) 1 and (H) 2, indicated on the left side of the spectra in the accompanying SERS maps. Dashed lines in panels B, C, E, G, and H denote the excitation laser at 785 nm (black) and the Raman Stokes lines of p-MA at 1080 (blue) and 1590 (pink) cm–1. These modes are indicated by the blue and pink arrows in Dii, respectively. Reproduced with permission from ref (97). Copyright 2012 American Chemical Society.

