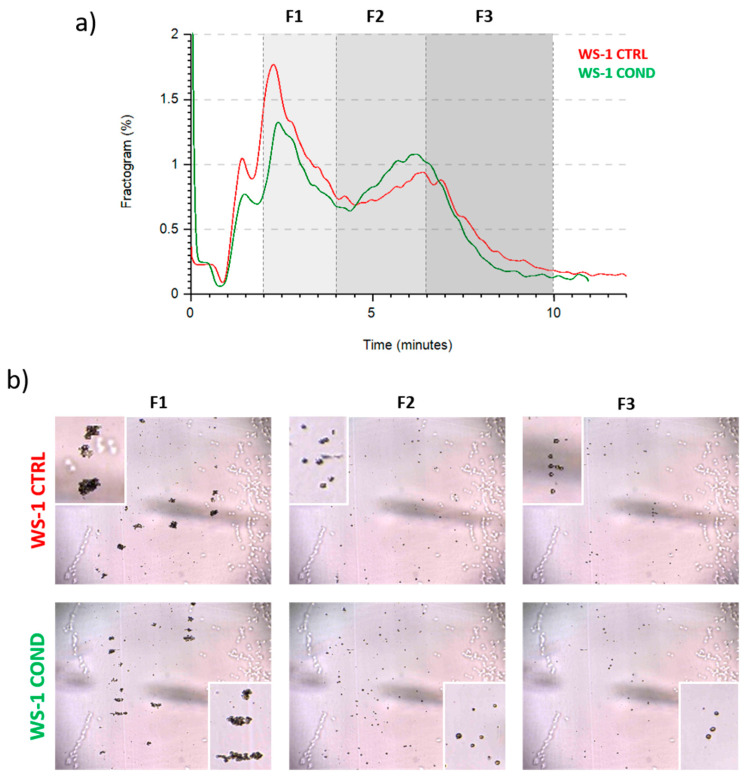
Figure 2.
(a) WS-1 CTRL and WS-1 COND fractogram. (b) Different frames obtained from post-processing analysis of WS-1 CTRL and WS-1 COND. Cellular aggregates are particularly evident at 2 min from the beginning of measurement. In the boxes, the images show the cellular aggregates and the single cells.

