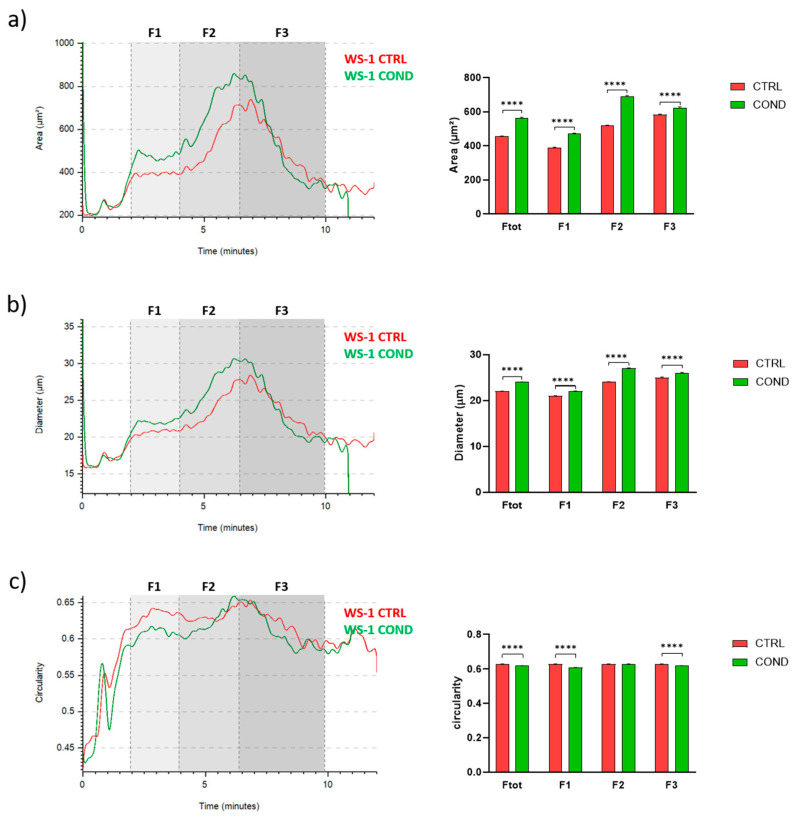
Figure 3.
(a) WS-1 CTRL and WS-1 COND area profile (μm2) vs. time of analysis in minutes (left panel). Area comparison between different fractions of WS-1 CTRL and WS-1 COND (right panel). (b) WS-1 CTRL and WS-1 COND diameter profile (μm) vs. time of analysis in minutes (left panel). Diameter comparison between different fractions of WS-1 CTRL and WS-1 COND (right panel). (c) WS-1 CTRL and WS-1 COND circularity profile vs. time of analysis in minutes (left panel). Circularity comparison between different fractions of WS-1 CTRL and WS-1 COND (right panel). Data are presented as a mean ± standard error mean (SEM). Statistical analysis was performed using two-way ANOVA test: **** p < 0.0001.

