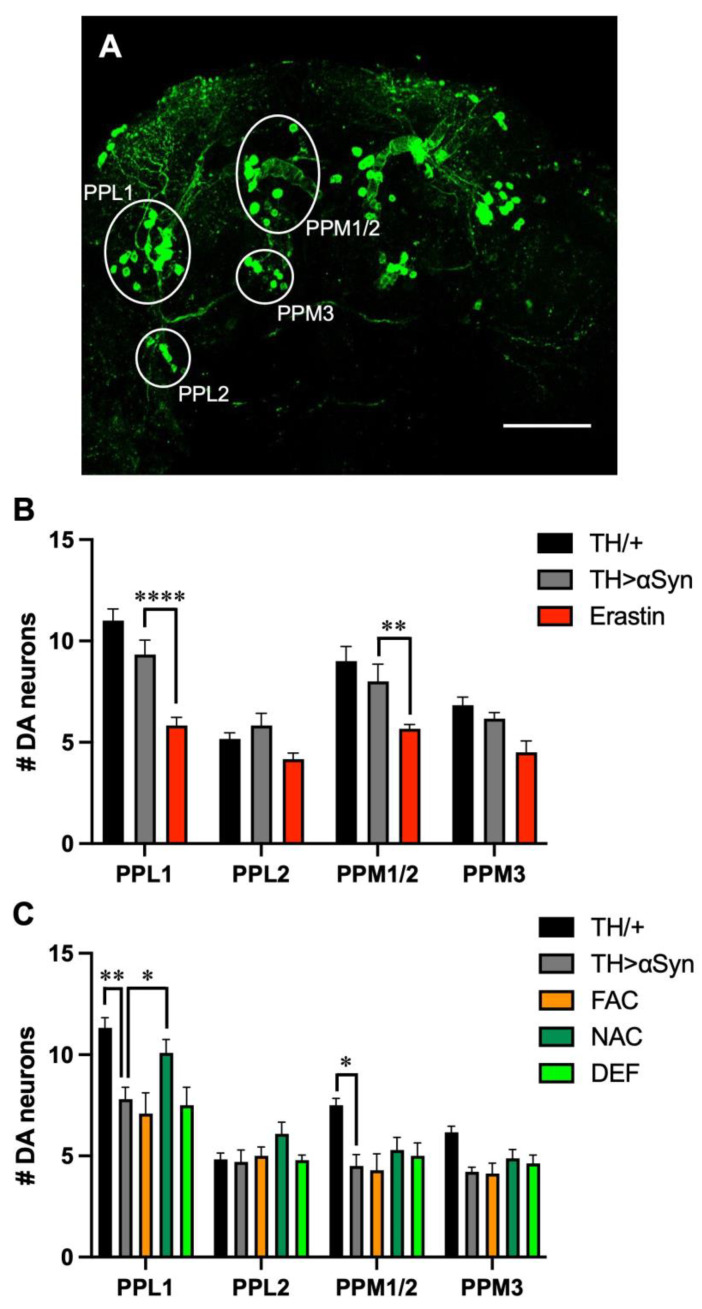
Figure 3.
Influence of ferroptosis modulators on α-Syn-induced dopaminergic neurodegeneration. (A) Representative immunofluorescent image, acquired on 1-week-old control (TH/+) flies, showing the localization and name of the main clusters of protocerebrum posterior dopaminergic neurons. Scale bar 50 μm (B) Quantitative analysis (mean ± SEM) was performed in 1-week-old control, untreated αSyn-overexpressing flies and following the treatment with Erastin. Analysis of variance and Tukey’s multiple comparisons post-hoc test indicate the following statistically significant differences: (PPL1) **** TH/+ vs. Erastin, **** TH > αSyn vs. Erastin; (PPM1/2) *** TH/+ vs. Erastin, ** TH > αSyn vs. Erastin; (PPM3) ** TH/+ vs. Erastin. (C) Quantitative analysis (mean ± SEM) was performed in 3-week-old control, untreated αSyn-overexpressing flies and following the treatment with FAC, NAC, and DEF. Analysis of variance and Tukey’s multiple comparisons post-hoc test indicate the following statistically significant differences: (PPL1) ** TH/+ vs. TH > αSyn, *** TH/+ vs. FAC, *** TH/+ vs. DEF, * TH > αSyn vs. NAC; (PPM1/2) * TH/+ vs. TH > αSyn, ** TH/+ vs. FAC. ****, ***, **, *, indicate p < 0.0001, <0.001, <0.01, <0.05. For the sake of clarity, only the statistically significant differences between untreated α-Syn over-expressing flies and the other conditions are reported in each graph.

