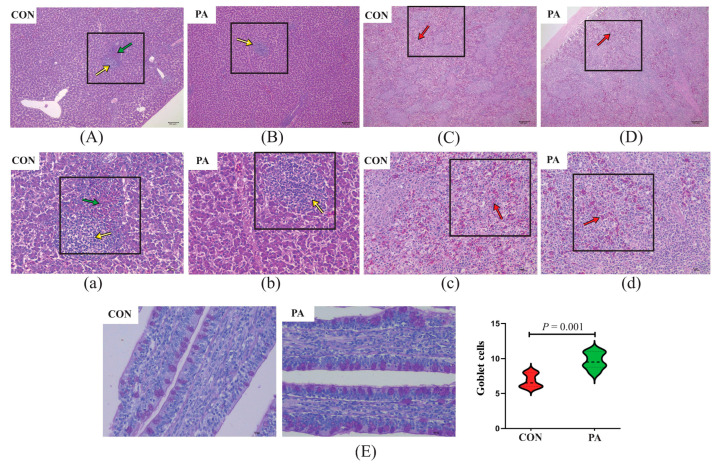
Figure 5.
Effect of P. acidilactici LC-9-1 on histological analysis of organs and ileal epithelial goblet cells in broilers at 21 a of age (n = 6). CON = control group, broilers were fed a corn–soybean basal diet, PA = P. acidilactici group, broilers were fed a basal diet containing 5.5 × 10⁹ CFU/kg P. acidilactici LC-9-1. (A,B) Liver H&E stained (100×); (C,D) spleen H&E stained (100×); (a,b) liver H&E stained (400×); (c,d) spleen H&E stained (400×). Yellow arrowheads indicate lymphocytic aggregates, green arrowheads indicate heterophilic granulocyte, red arrowheads indicate splenic congestion. (E) Representative images of ileal PAS stained (400×) and statistical analysis of the number of epithelial goblet cells.

