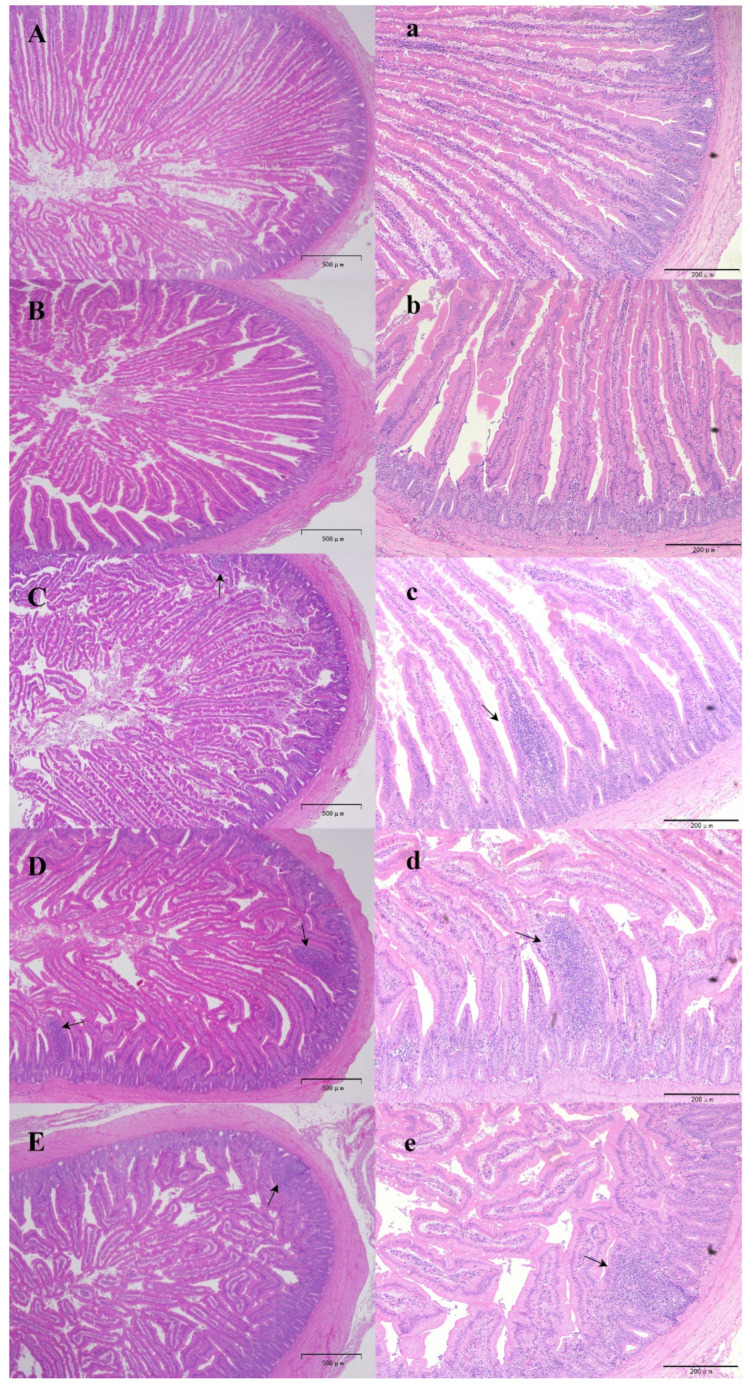
Figure 2.
The effects of H2O2 injection on the morphology of duodenum (A–E,a–e) magnification was 40× and 100×, respectively. (A,a) show the duodenum of the control group; (B,b) show the duodenum of the negative control group; (C,c) depict the duodenum of the low-dose group; (D,d) show the duodenum of the medium-dose group; (E,e) displays the duodenum of the high-dose group; (→) Inflammatory cell infiltration.

