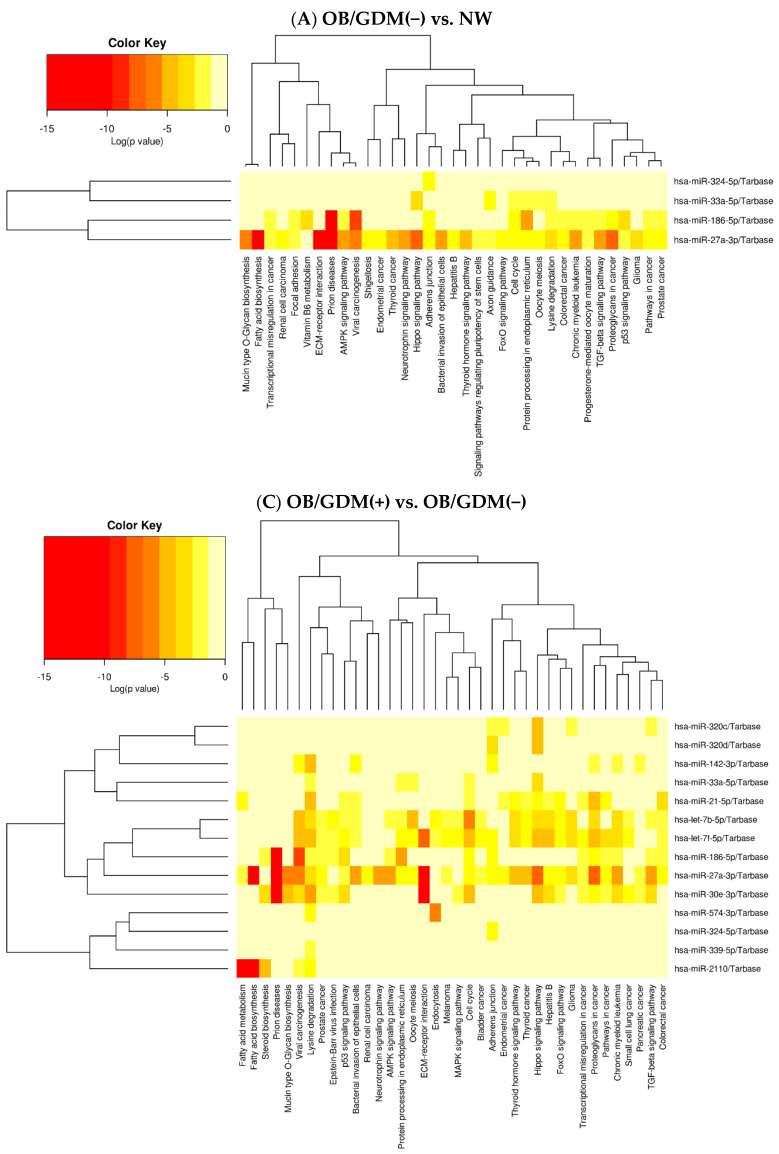
Figure 2.
Heat maps by DIANA–miRPath v.3 showing miRNAs’ clusters and associated pathways obtained by union analysis for the following comparisons: (A) OB/GDM(−) vs. NW, and (C) OB/GDM(+) vs. OB/GDM(−). For each panel, the analysed miRNAs are listed on the right. The specific pathways, determined to be significant via miRNA pathway enrichment analysis, are listed at the bottom. The force of association (Log(p-value)) between the analysed miRNAs and the pathways is indicated by the colour key reported in the upper left corner. Log: log10 p-value.

