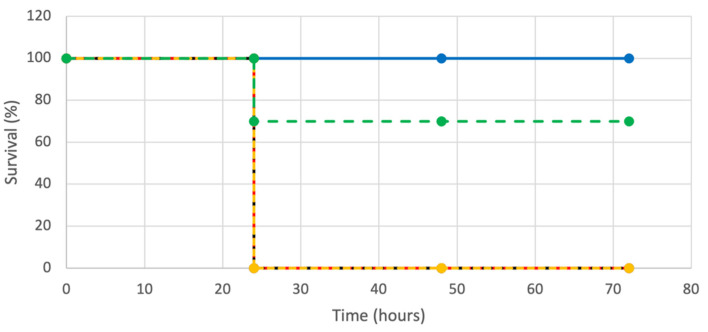
Figure 7.
Kaplan–Meier survival curves for G. mellonella following injections of P. aeruginosa PAO1, with LL-37 and PMB, alone or in combination. One hundred twenty-five G. mellonella were injected with 5.0 × 101 P. aeruginosa PAO1 cells. After 20 min at 4 °C, the G. mellonella were injected with LL-37 and PMB, alone or in combination. Twenty-five G. mellonella were injected for each condition with the following antimicrobial agent concentrations: 32 µg/mL LL-37 (black, dotted line), 0.25 µg/mL PMB (yellow, dotted line), and 0.25 µg/mL PMB + 32 µg/mL LL-37 (green, dotted line). Twenty-five G. mellonella were included in control conditions of 5.0 × 101 P. aeruginosa PAO1 cells in the absence of PMB injection (red, dotted line), and PBS injection with neither bacterial cells nor PMB injections (blue, solid line). The survival of the worms was evaluated every 24 h for 72 h.

