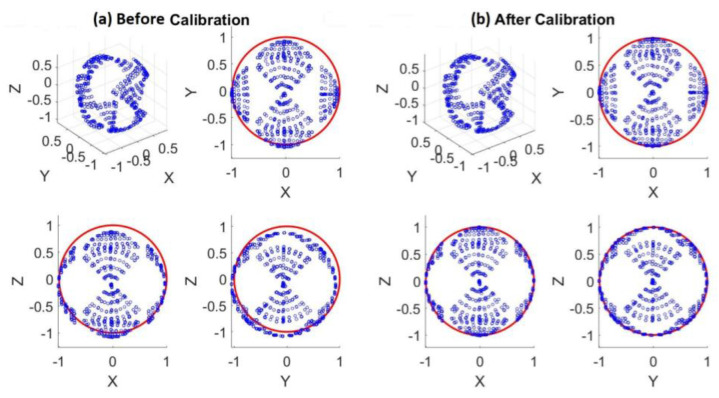
Figure A1.
Illustration of the accelerometer’s magnitude calibration. Data points shown in blue represent accelerations in units of gravity measured in different directions for stationary periods, and the red circle shows the target unit sphere with a radius of 1 g. Imperfections before calibration (a) are resolved by the corrections after calibration (b).

