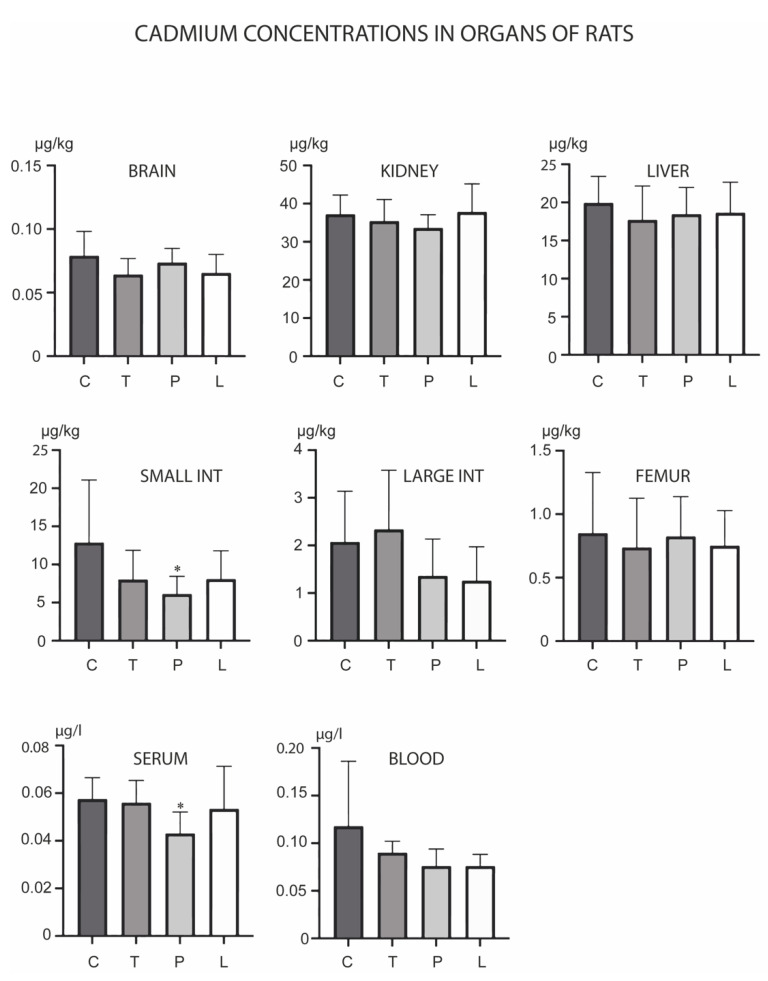
Figure 3.
Concentrations of cadmium in the brain, kidney, liver, small intestine, large intestine, serum, blood and femur after the three-month oral administration of silicates. C denotes the control group; T denotes the experimental group receiving TMAZ; P denotes the experimental group receiving PMA; and L denotes the experimental group receiving Ludox silica. Asterisk (*) denotes significant differences between the experimental groups, with control at p < 0.05.

