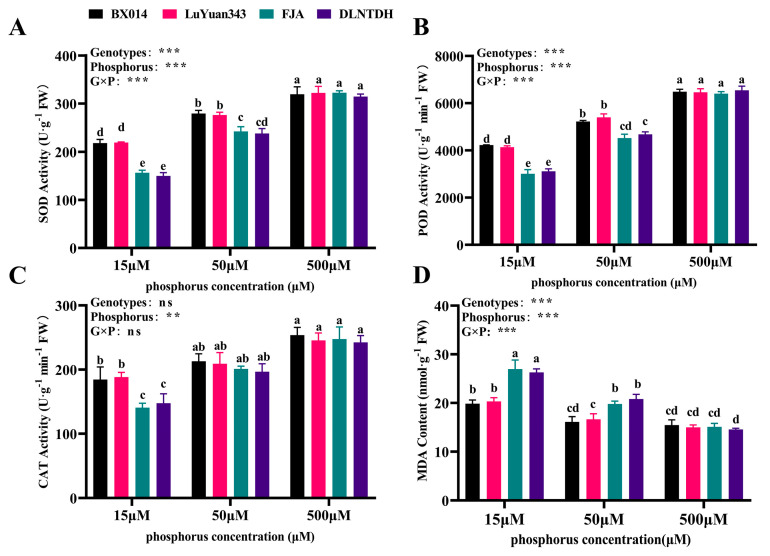
Figure 4.
Various P treatments’ effects on antioxidant substances. (A) SOD (superoxide-dismutase) activity, (B) POD (peroxidase activity, (C) CAT (catalase) activity, and (D) MDA (malondialdehyde) content in the cotton genotypes, fully expanded barley leaves. The results are expressed as means ± SE (n = 7). Statistically significant changes are indicated by different letters, using the two-way ANOVA and multiple-comparison test (p ≤ 0.05). p-values of the ANOVAs of genotypes (G), phosphorus level (P), and their interaction (G×P) are indicated as ns, not significant; **: p < 0.01, ***: p < 0.001.

