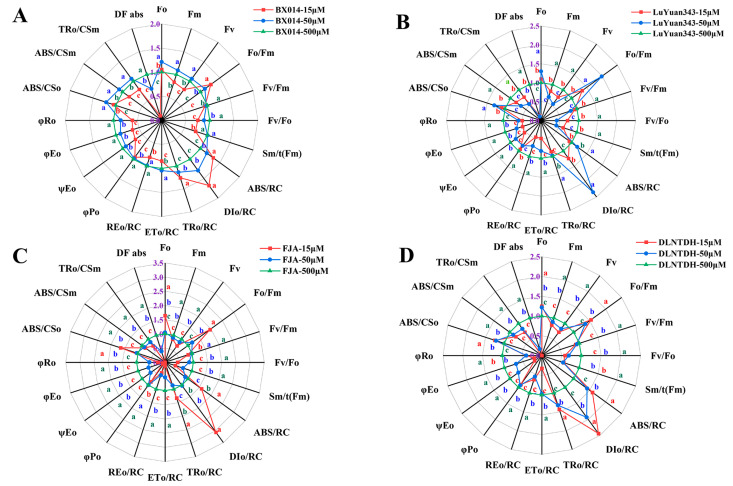
Figure 7.
Spider plot of Chl a fluorescence of cotton leaves, the value of 500μM P set 1. (A) BX014, (B) LuYuan343, (C) FJA, (D) DLNTDH, at different P treatments. The results are expressed as means ± SE (n = 7). Statistically significant changes are indicated by different letters, using the one-way ANOVA and multiple-comparison test (p ≤ 0.05).

