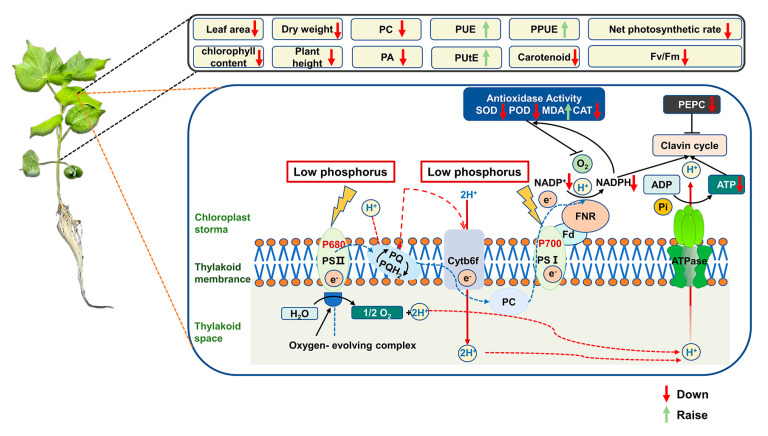
Figure 9.
Pictorial representations of photosynthetic-electron-transport changes and feedback mechanisms responsible for low P availability. Processes that appear to be down-regulated are indicated by red arrows, while green arrows indicate processes that appear to be up-regulated. Unit size and font size represent the activities of the organelle components.

