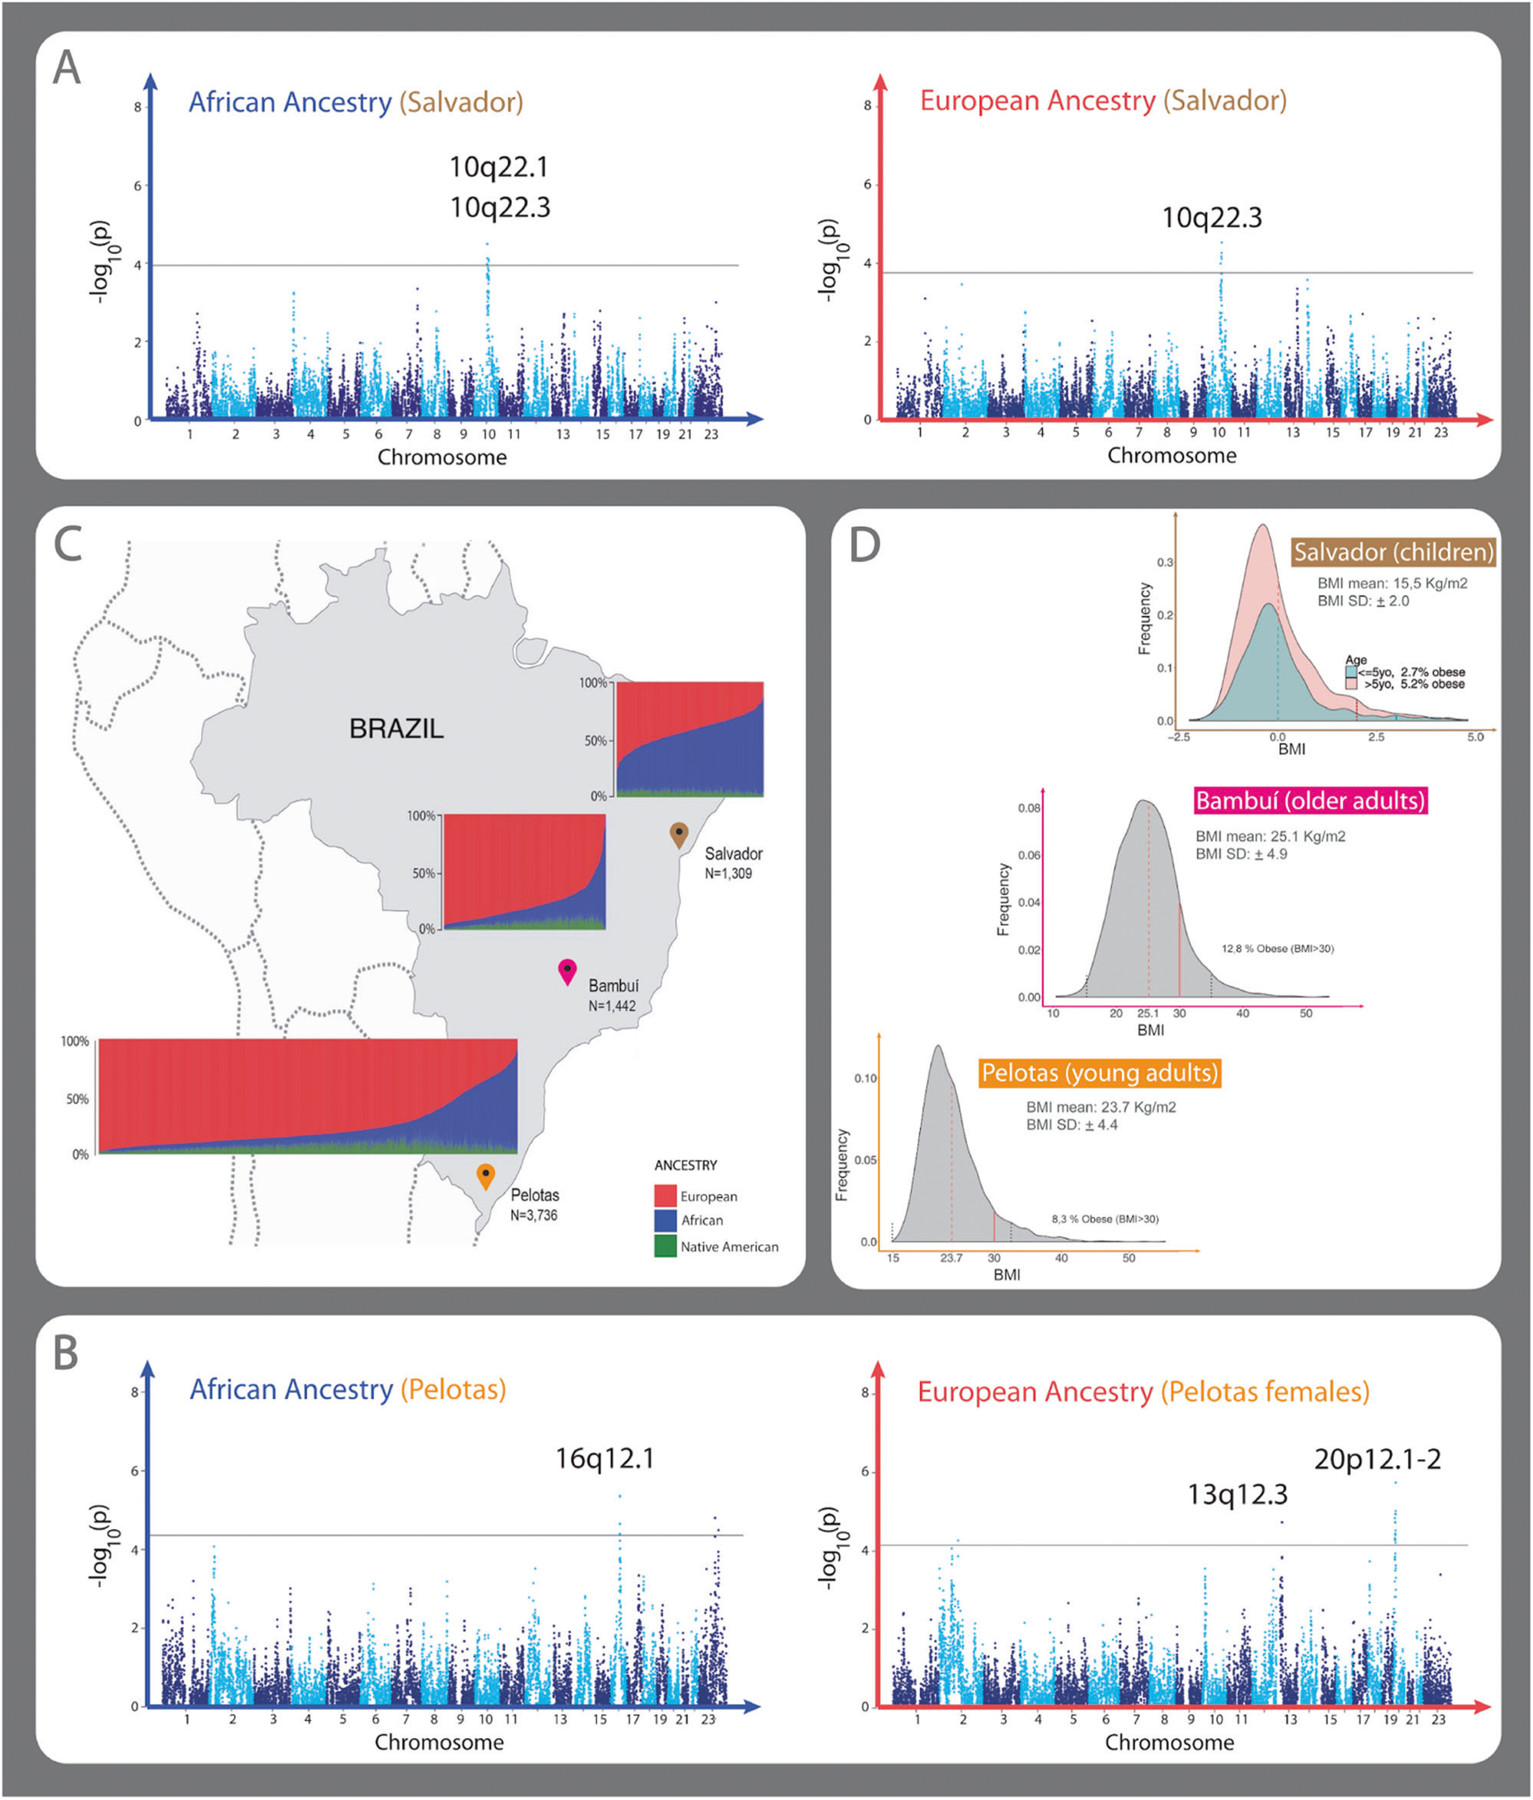
Fig. 1. Admixture in the Brazilian cohorts, BMI distributions, and admixture mapping (AM) Manhattan plots with significant peaks.

A, B Manhattan plots showing AM peaks using linear regressions with PCAdmix local ancestry inferences. Consensus significant AM peaks for PCAdmix and RFMix local ancestry inferences are specified on each plot. A Manhattan Plot showing the AM results of African (left) and European (right) ancestry in Salvador cohort. African ancestry AM shows two positive significant peaks 10q22.1 (β = 0.36, p value = 3.21e−05) and 10q22.3 (β = 0.36, p value = 7.87e−05). European AM ancestry analysis shows one negative associated peak 10q22.3 (β = −0.36, p value = 2.92e−05). B Manhattan plot showing the AM results of African (left) and European (right) ancestry in the Pelotas cohort. One peak in 16q12.1 (β = −0.80, p value = 4.30e−06) was observed associated with African ancestry, and two associated peaks, 13q12.3 (β = −0.95, p value = 1.84e−05) and 20p12.1–2 (β = −1.05, p value = 1.79–06), with European ancestry in females. Results are presented as log10(p value) to the given ancestry of each window of 100 SNPs along the genome. Black line in the Manhattan plots correspond to the genome-wide threshold p value estimated for the given ancestry and dataset (Table S5). The linear regression coefficient (β) and p values for all peaks correspond to the lead window, the genomic window with the most significant p value in the linear regression result. C Brazilian regions and continental individual ancestry bar plots for each cohort. D Histogram of Z-score adjusted by sex and age according to WHO guidelines in Salvador (top), histogram of BMI in Bambui (center) and Pelotas (bottom) cohorts.
