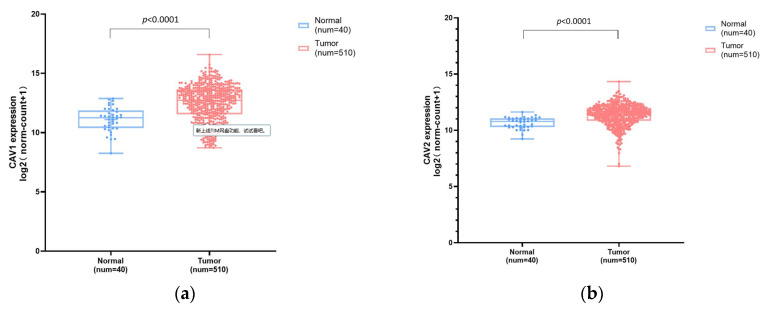
Figure 2.
Comparison of mRNA expression levels of CAV1 and CAV2 between HNSC and normal tissues. Box plot chart ((a), mean ± SD: Normal: 11.11 ± 1.02, Tumor: 12.51 ± 1.53; (b), mean ± SD: Normal: 10.65 ± 0.50, Tumor: 11.35 ± 0.95) showing the expression levels of CAV1 and CAV2 in HNSC and their adjacent normal tissues.

