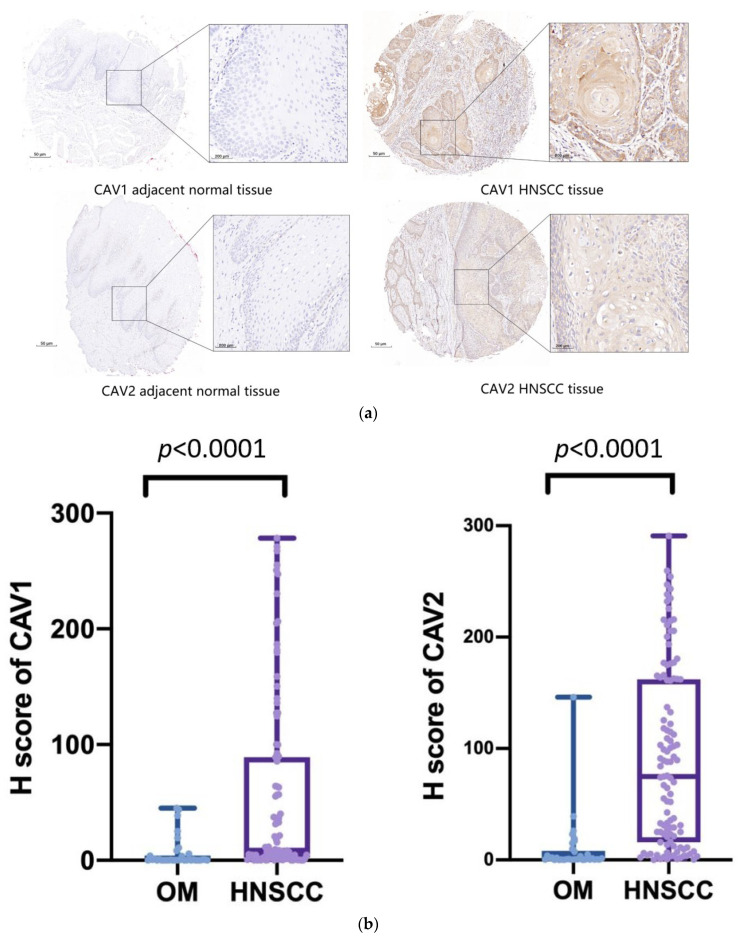
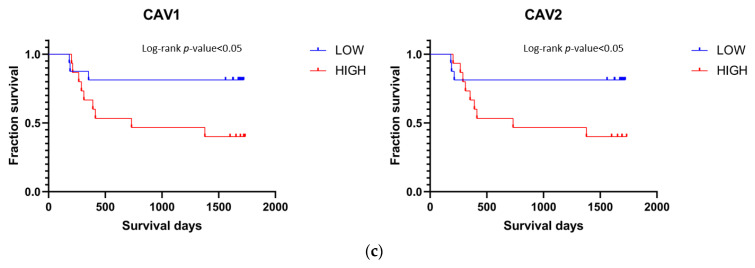
Figure 11.
IHC analysis of cancer and paracancerous tissues in 172 patients confirms the CAV1 and CAV2 protein levels in HNSCC tissues, revealing that CAV1 and CAV2 are upregulated in HNSCC (a). The result shows a significant correlation is found for H-score in HNSCC and in OM cases after comparing the H-score, which represents the expression levels of target genes (p < 0.0001) ((b); mean ± SD: 6.21 ± 0.07; mean ± SD: 54.89 ± 2.36; mean ± SD: 9.72 ± 0.07; mean ± SD: 90.64 ± 95.81). Survival analysis shows a significant correlation between the low expression levels of CAV1 and CAV2 and longer survival days, indicating better prognostic performance (c).


