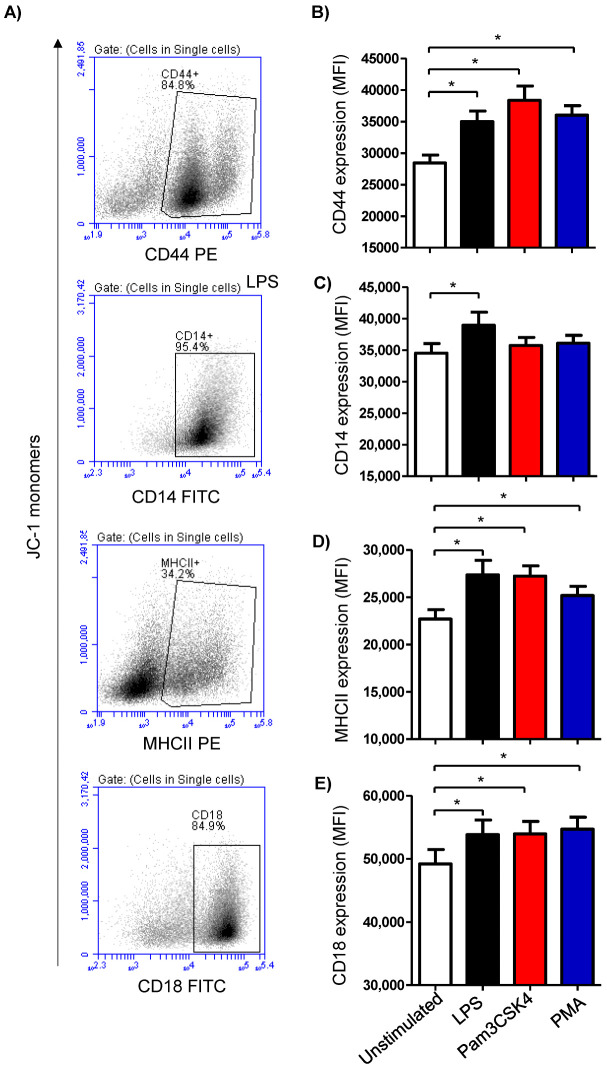
Figure 3.
Analysis of the expression of the cell marker antigens CD44, CD14, MHCII, and CD18 on milk cells. Cells were separated from stimulated and non-stimulated milk samples, stained with monoclonal antibodies, and analyzed using flow cytometry. (A) Representative density plots (SSC-H against specific staining with the corresponding antibody) showing the expression density of the cell surface antigens after setting a gate on single cells. (B) Mean fluorescence intensity (MFI) of CD44 (B), CD14 (C), MHCII (D), and CD18 (E) on milk cells (n = 7 camels). * indicates statistically significant differences between the groups (n = 7 camels; p values less than 0.05).

