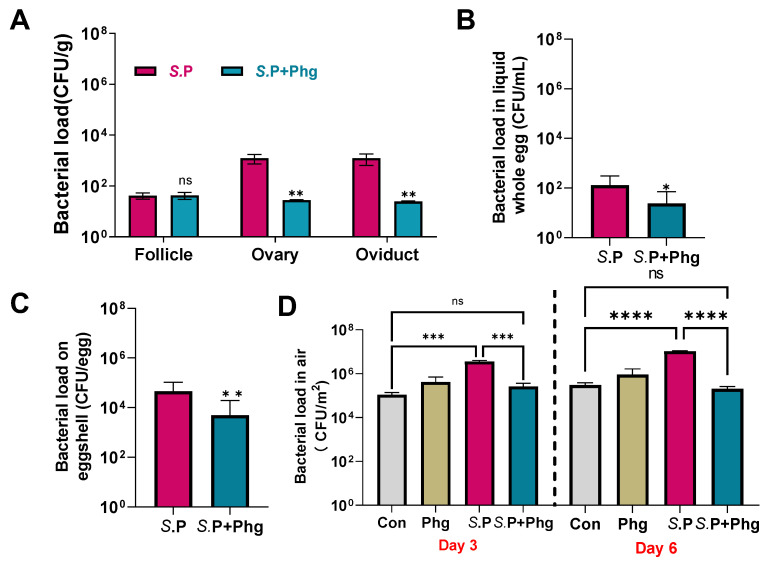
Figure 6.
Phage CKT1 controlled the vertical transmission of S. Pullorum. (A) S. Pullorum load in tissues at 6 d. n = 5. (B) S. Pullorum load in liquid whole eggs at 2–6 d. n = 11 at S.P and n = 10 at S.P + Phg. (C) S. Pullorum load on eggshell at 2–6 d. n = 11 in S.P group and n = 10 in S.P + Phg group. * p < 0.05 (Mann–Whitney test); ** p < 0.01; ns, no significance. (D) Bacterial load in the air at day 3 and day 6. n = 3. Error bars represent the standard deviations. *** p < 0.001 (One-way ANOVA and post hoc Tukey’s test); **** p < 0.0001; ns, no significance. S.P, only Salmonella challenged; Con, the control group; Phg, only phage treated; S.P + Phg, Salmonella challenged and phage treated.

