Figure 5.
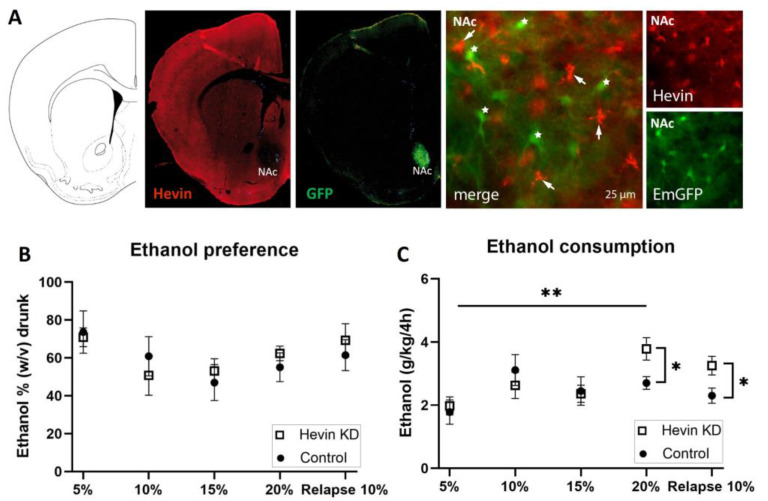
Effect of hevin protein downregulation in nucleus accumbens (NAc) astrocytes on ethanol consumption in mice. (A) Immunohistochemical validation of hevin downregulation in NAc astrocytes after injection of miRNA-containing viruses. Hevin immunofluorescence, in red, is absent in astrocytes infected with hevin miRNA and co-expressing EmGFP (star). Non-transfected astrocytes express hevin (arrow). (B) Ethanol preference quantification every third day of each ethanol concentration. (C) Ethanol consumption quantification every third day of each ethanol concentration. The ordinate represents the average of the percentage of ethanol taken by hevin KD and control groups (B) or the grams of ethanol per kg of mouse weight taken in 4 h (C). The abscissa shows the ethanol concentration tested. n = 8/group. Mann-Whitney test was used for the comparison of the preference and consumption between the hevin KD mice and controls (* p < 0.05, ** p < 0.01); and Friedman followed by Dunn’s post-hoc test was used for the comparison of the preference and consumption between ethanol concentrations. Values represent mean ± SEM.

