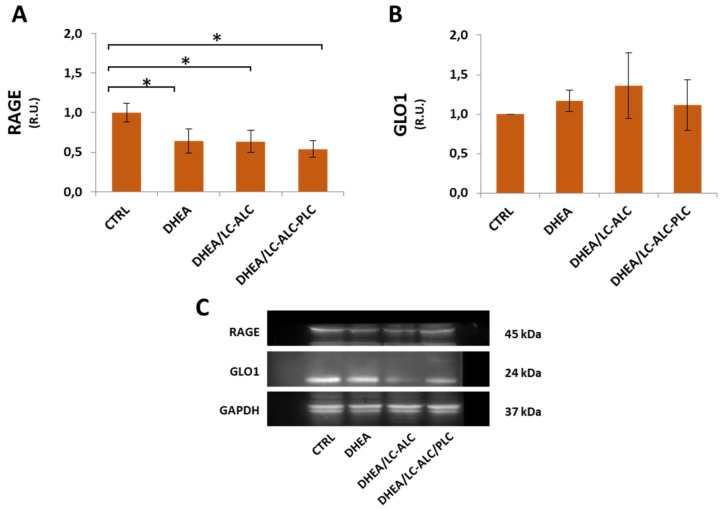
Figure 12.
Western blot analysis of RAGE (A) and GLO1 (B) and representative images (C). Three mice per experimental group were employed. Experiments were done in triplicate. Data obtained from n = 9 observations are presented as means ± SEM of densitometric analysis of immunoreactive bands normalized to internal reference protein (glyceraldehyde-3-phosphate dehydrogenase, GAPDH). * p < 0.01 vs. CTRL, t-test.

