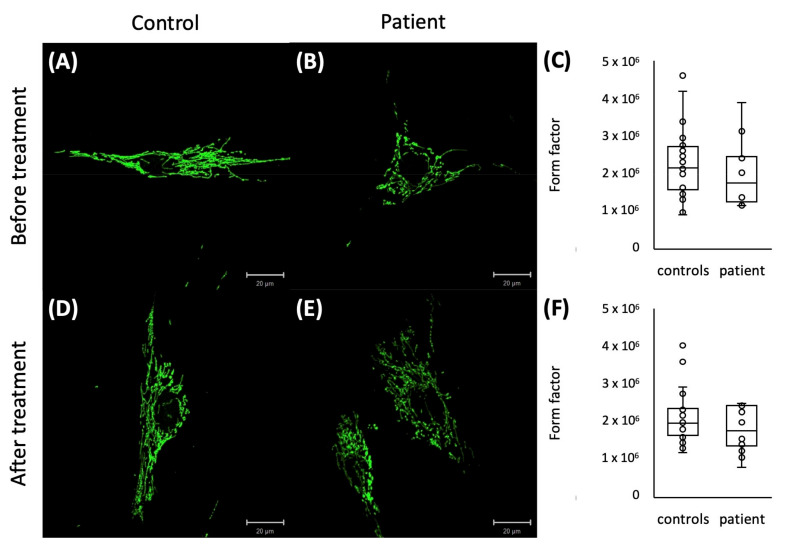
Figure 4.
Representative pictures of immunostaining of cultured fibroblasts with GRP75 of a control (A,D) and a patient (B,E) before (A,B) and after paraquat treatment (D,E) with a trend to a reduced mitochondrial branching in P1 before (C) and after paraquat treatment (F) represented by a reduced form factor.

