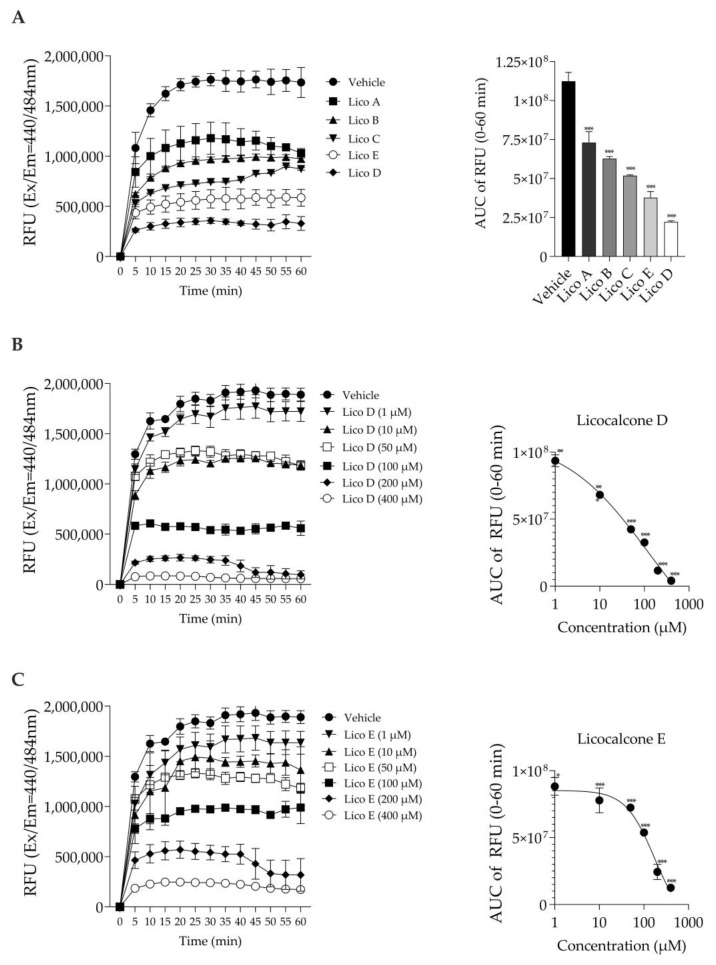
Figure 2.
Effect of Licos A, B, C, D and E on Aβ1-42 aggregation. The right-side figure is the AUC of the left-side figure. (A) The aggregation of Aβ1-42 (213 µg/mL) in the absence or presence of Licos. The concentration of substances was 100 μM. (B) The aggregation of Aβ1-42 in the absence or presence of Lico D. (C) The aggregation of Aβ1-42 in the absence or presence of Lico E. The AUC data were fitted to non-linear regression analysis. Values are the mean ± SD (n = 3 samples/group). * p < 0.05, ** p < 0.005 and *** p < 0.0005 vs. vehicle control. Statistical analysis of the data was performed using Dunnett’s multiple comparisons test.

