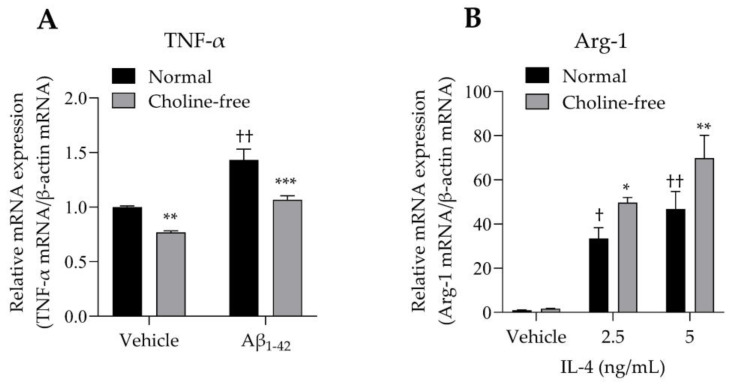
Figure 5.
Effect of choline deficiency on TNF-α and Arg-1 mRNA expression in SIM-A9 cells stimulated by Aβ1-42 and IL-4. (A) Expression of TNF-α mRNA in SIM-A9 cells stimulated with 10 μM Aβ1-42 in normal or choline-free medium for 4 h. Values are the mean ± SD (n = 3). ** p < 0.005 and *** p < 0.0005 compared with normal culture medium under the same condition. †† p < 0.0001 compared with the vehicle of normal culture medium. Statistical analysis of the data was performed using Šídák’s multiple comparisons test. (B) Expression of Arg-1 mRNA in SIM-A9 cells stimulated with IL-4 (2.5 and 5 ng/mL) in normal or choline-free medium for 4 h. Values are the mean ± SD (n = 3). * p < 0.05 and ** p < 0.005 compared with normal culture medium under the same condition. Statistical analysis of the data was performed using Šídák’s multiple comparisons test. † p < 0.01 and †† p < 0.0001 compared with the vehicle of normal culture medium. Statistical analysis of the data was performed using Dunnett’s multiple comparisons test. Relative expression is expressed as a ratio of the target mRNA to β-actin mRNA.

