Figure 4.

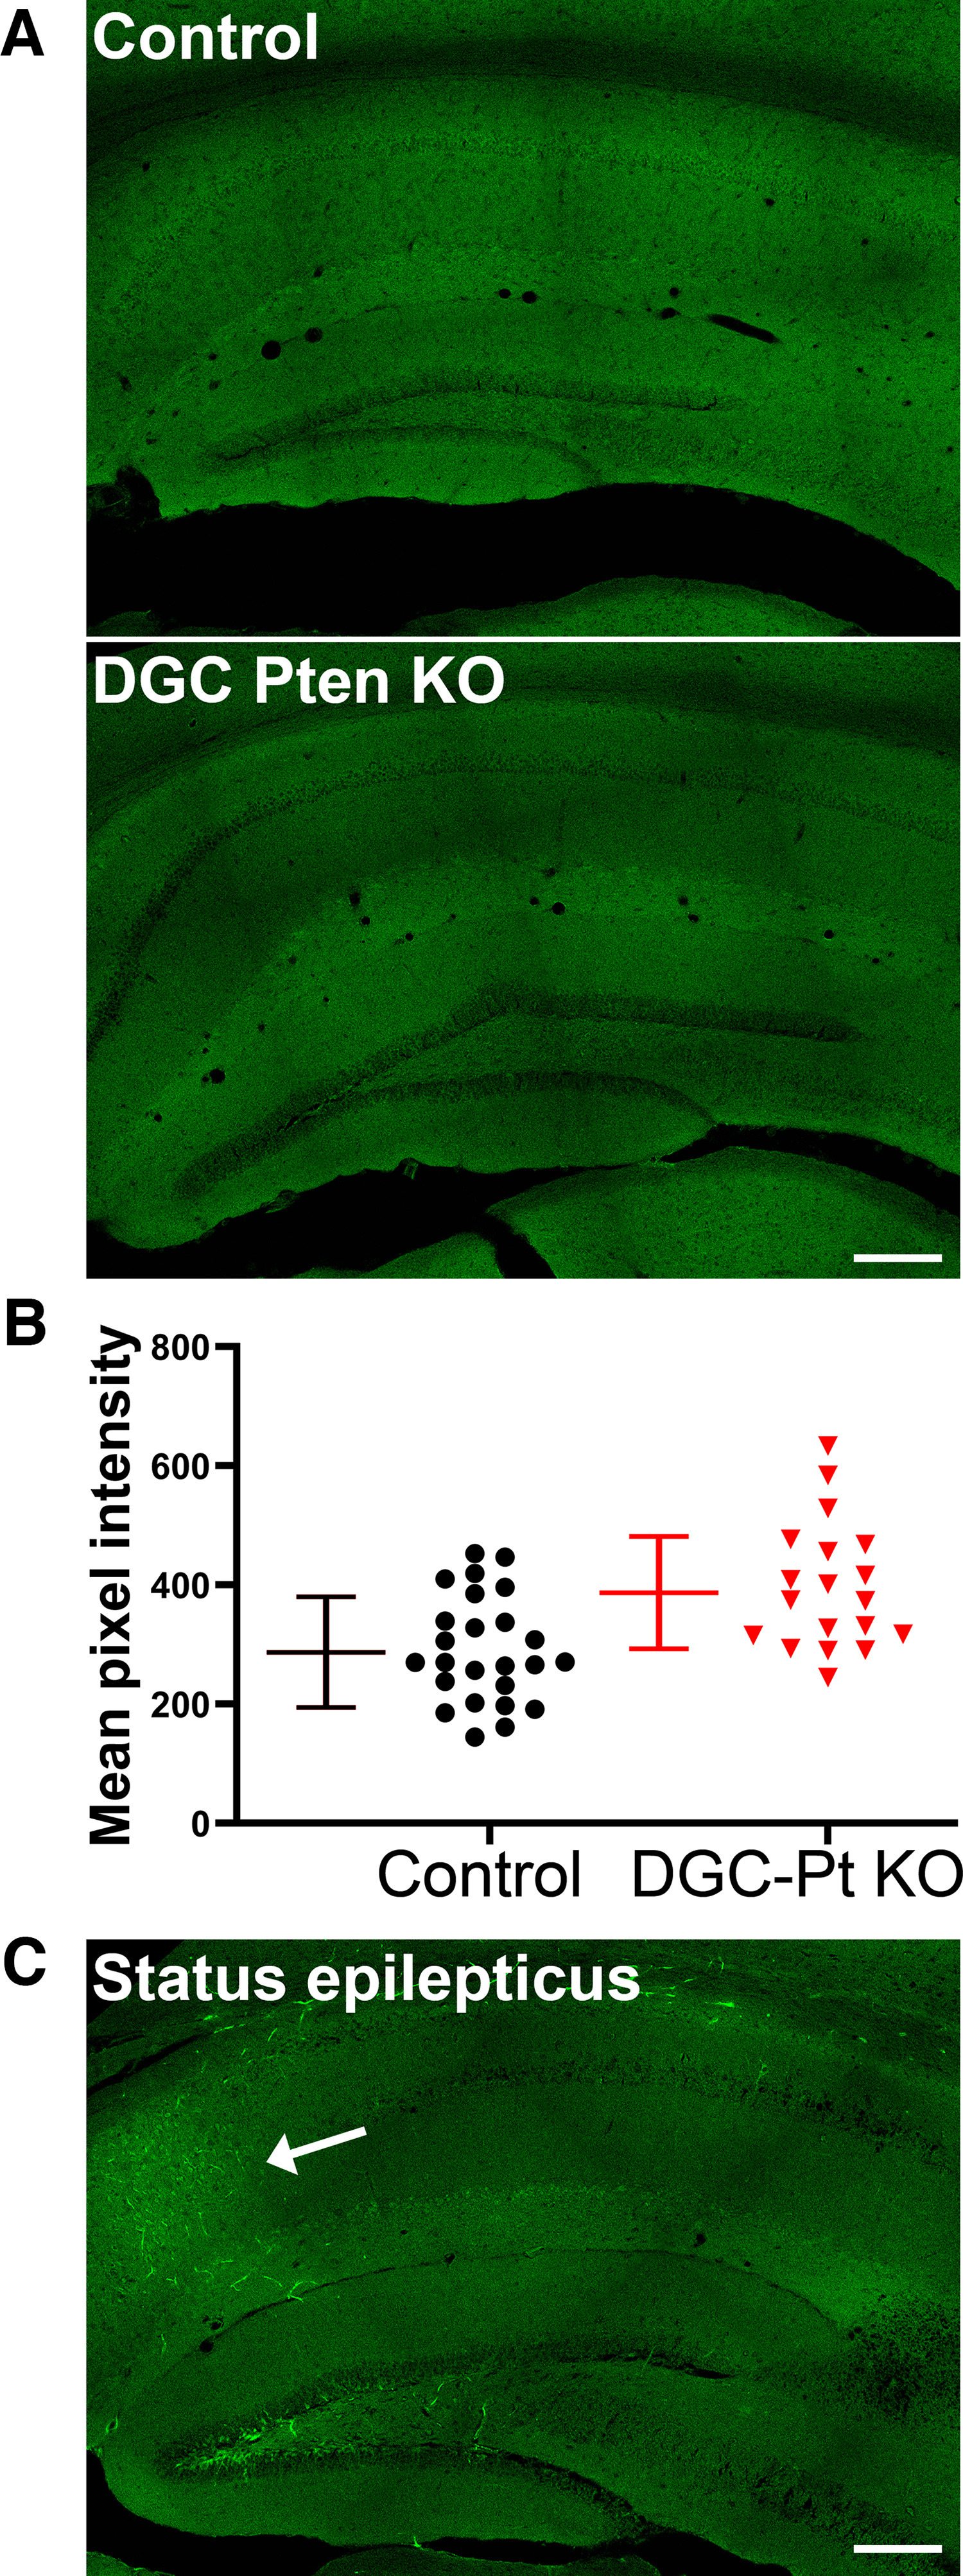
A, AF488-BSA fluorescence in the hippocampi of a control mouse and a DGC-Pten (Pt) KO mouse. No evidence of extravascular AF488-BSA was seen in either group. Scale bar = 200 μm. B, Symbols denote the mean pixel intensity of the AF488-BSA signal for each control and DGC-Pten KO dentate gyrus brain section. Bars show animal means and SD (N = 5 controls and 4 DGC-Pten KOs, 4–7 sections/mouse; p = 0.1195). C, AF488-BSA fluorescence in the hippocampus of a mouse that went through pilocarpine-induced status epilepticus. This positive control animal shows a clear increase in AF488-BSA labeling in the CA1 pyramidal cell layer (arrow). Scale bar = 200 μm.
