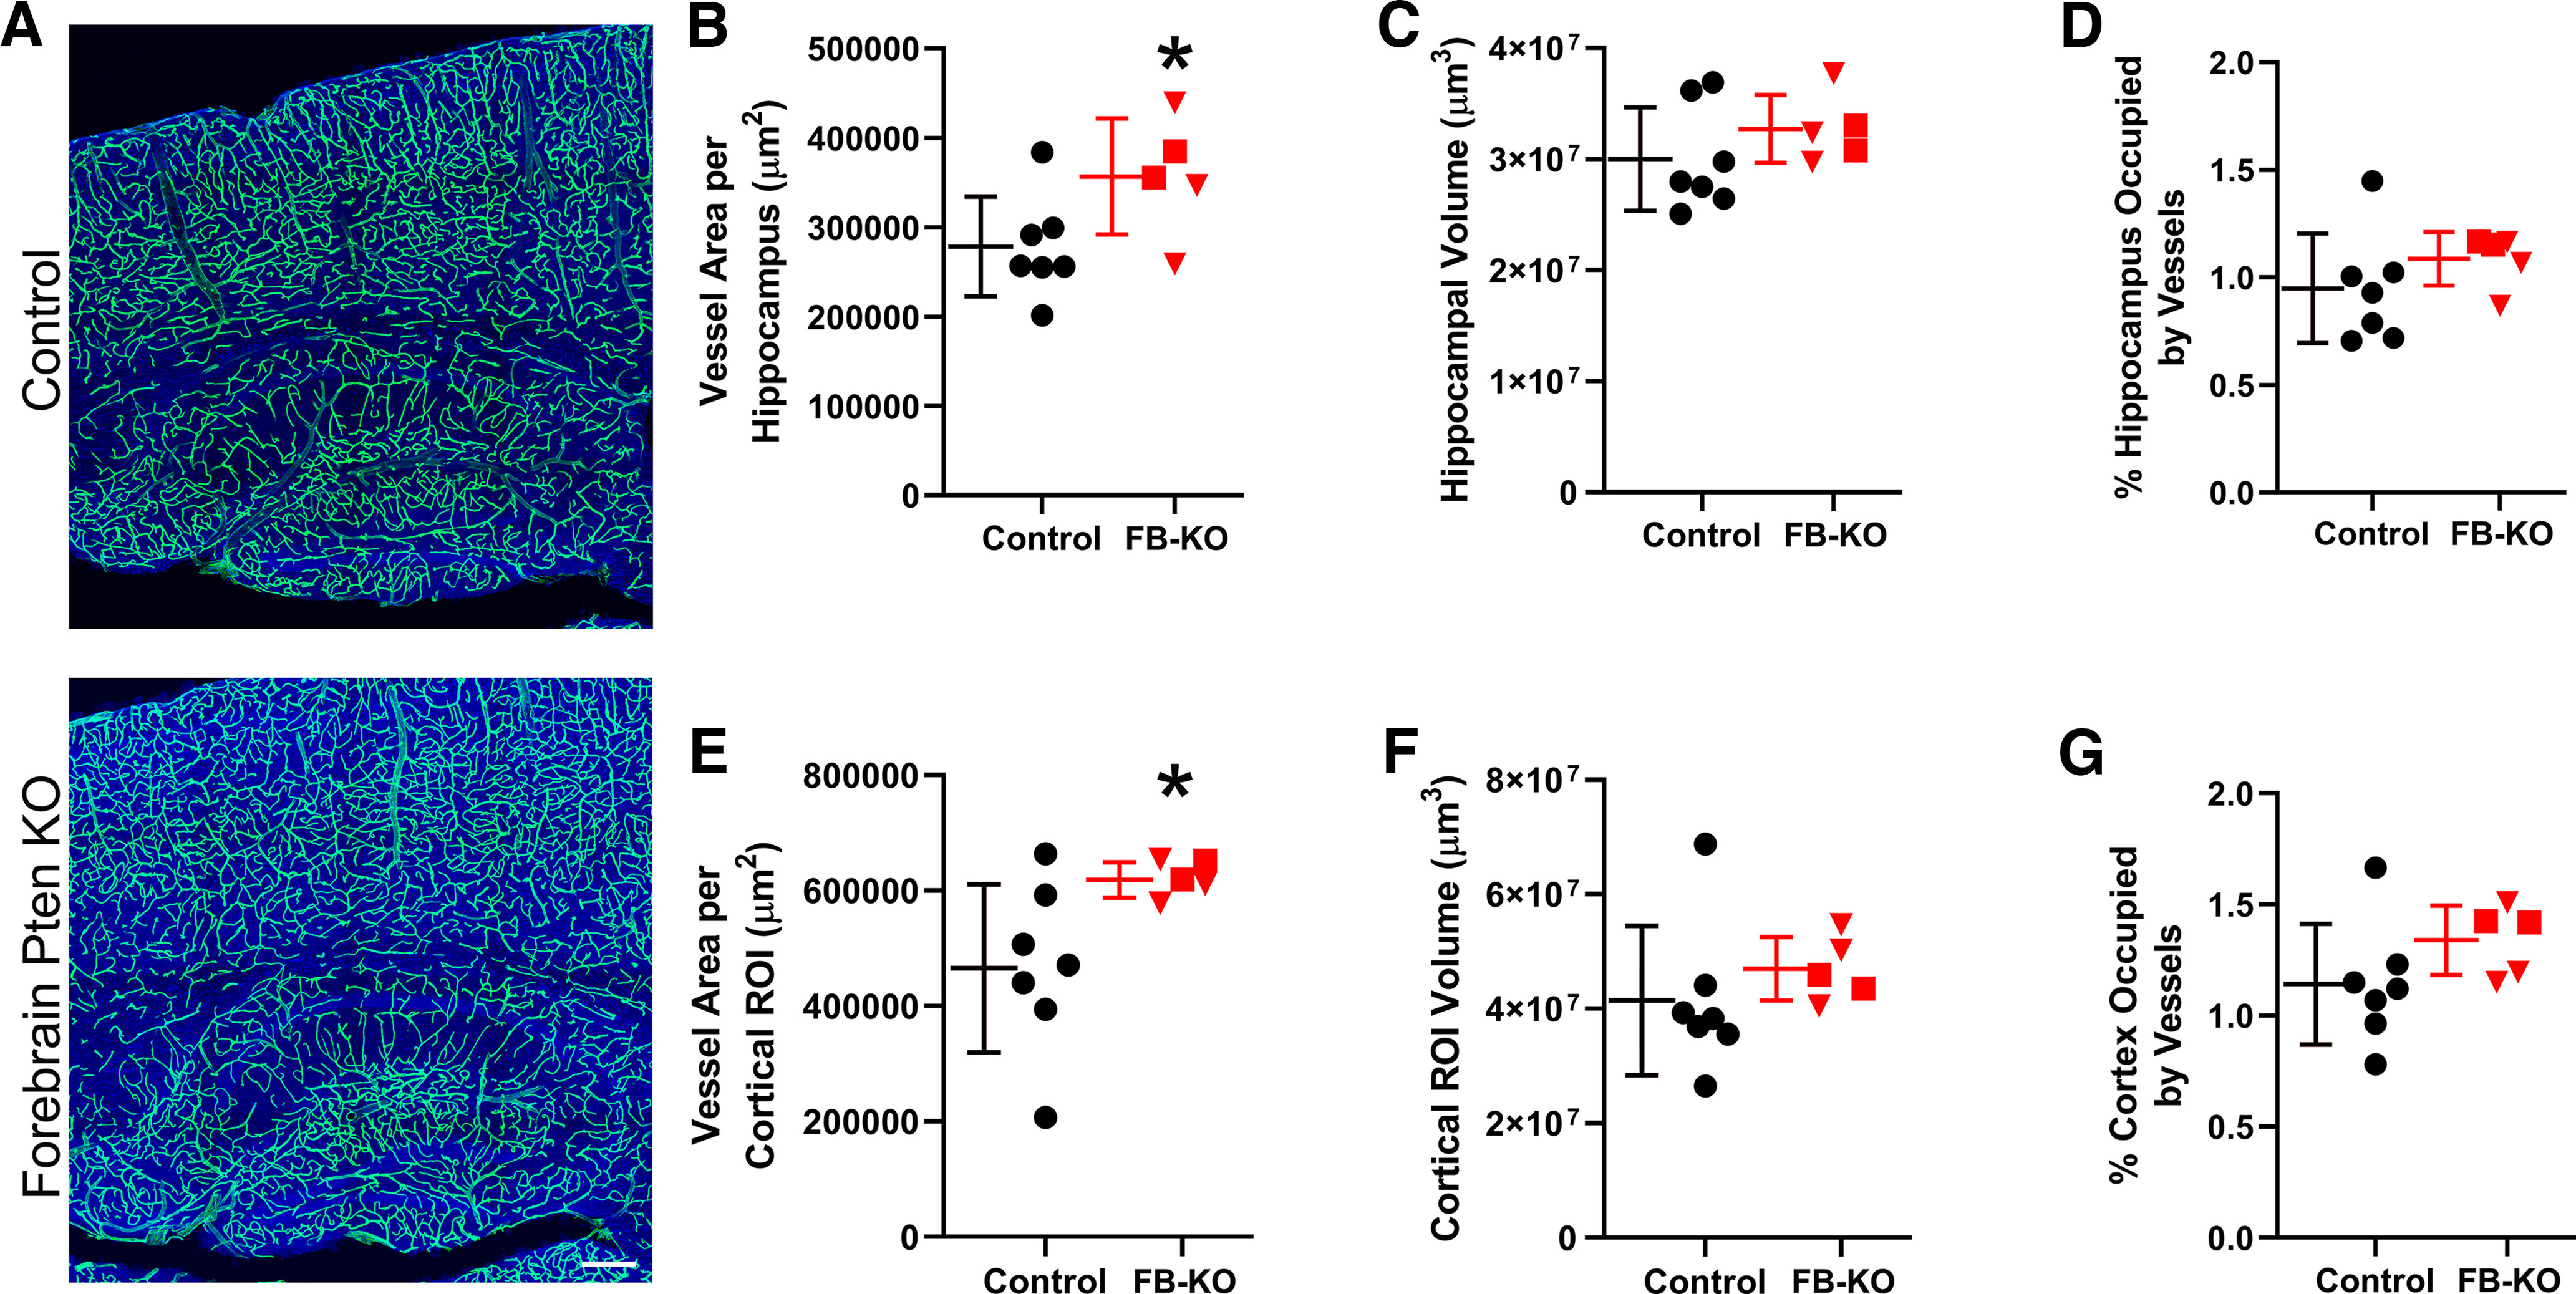
Figure 5.

A, Confocal images of hippocampus and cortex showing blood vessels labeled with DyLight 649-lectin (green). The tissue is counterstained with nuclear blue. Scale bar = 200 μm. B, E, Graphs show scatterplots of individual animal scores and group means ± SD for vessel area in control (black) and Forebrain (FB)-Pten KO (red) animals for hippocampus (B) and cortex (E). Area was calculated from maximum projections of images from 20-μm-thick sections. C, F, Scatter plot and group means for the volume of the hippocampus (C) and cortex (F) in 20-μm-thick sections. D, G, Vessel area (B, E) was normalized to dentate volume (C, F) to estimate the percentage of the hippocampus (D) or cortex (G) occupied by vessels in 20-μm-thick slices. Red squares denote the two CamK2α-Cre+/−, Ptenfl/- mice with germline loss of one Pten allele. *p < 0.05.
