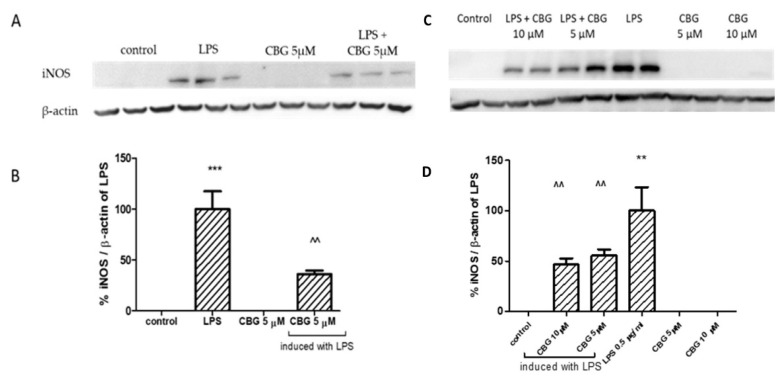
Figure 4.
CBG decreased iNOS expression in LPS-induced BV2 microglia (A,B) and primary rat glial cells (C,D). Immunodection of iNOS with or without induction of LPS (7 ng/mL) in the presence or absence of CBG (5 μM) for BV2 (A,B) and with or without induction of LPS (0.5 µg/mL) in the presence or absence of CBG (5 and 10 μM) for primary rat glial cells (C,D). Forty (40) μg of protein from whole cell lysate was loaded on 7.5% polyacrylamide-SDS gels and blotted on a nitrocellulose membrane. Protein quantities were normalized to β-actin levels. Analysis of iNOS was performed using antibodies against iNOS (130 kDa) and β-actin (40 kDa). Band intensity analysis was performed using ImageJ software. Results are representative of two independent experiments and are presented as means ± SEM (n = 4–6). *** p <0.001 vs. control; ** p <0.005 vs. control; ^^ p < 0.005 vs. LPS.

