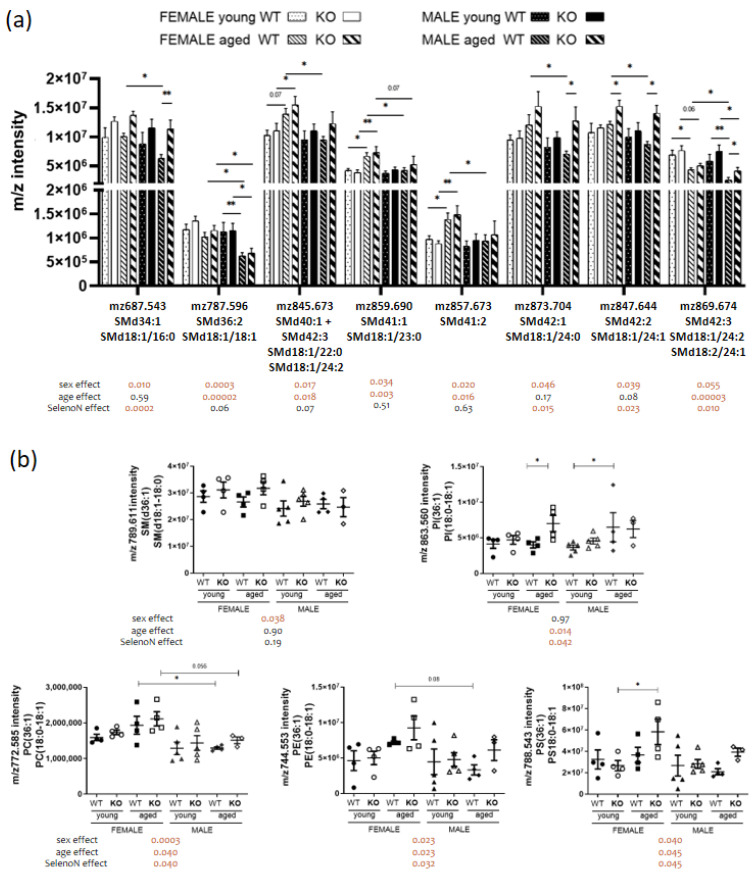
Figure 5.
Sphingomyelin and PL (36:1) remodeling in a sex, age and/or SelenoN KO context. (a) Analysis of m/z intensity of SM species (mean ± SEM; n = 4 for each group, except young male WT and KO with n = 5 and aged male KO with n = 3). (b) Analysis of m/z intensity of PL (36:1) species. In the graph, p-value are from Tukey’s post hoc tests between pairwise groups. Under the graph, p-values for sex, age and SelenoN effect are defined in Table 2. * p < 0.05 and ** p < 0.01.

