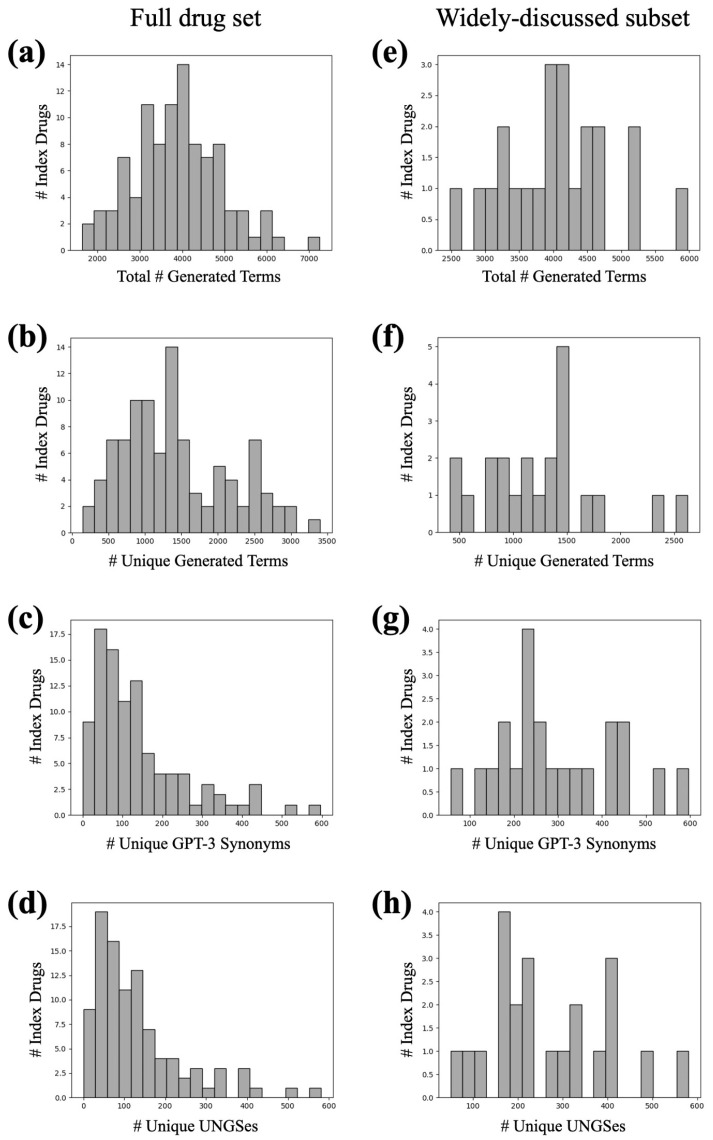
Figure 8.
Histograms showing various distributions of quantities for each index term in the full lexicon of 98 drugs of abuse (a–d) and the subset of 22 widely-discussed drugs of abuse (e–g). Quantities depicted are total generated terms (a,e), unique generated terms (b,f), unique GPT-3 synonyms (generated terms passing filters) (c,g), and UNGSes (generated terms passing filters and not present in RedMed) (d,h).

