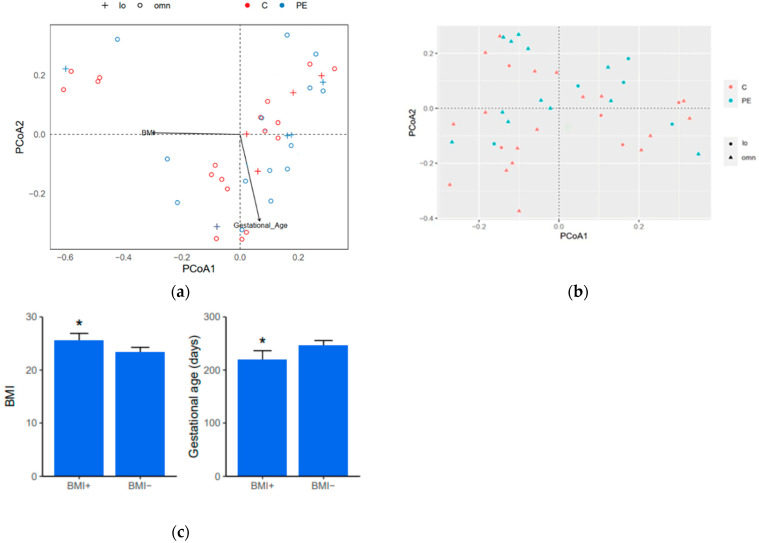
Figure 2.
Diversity indices for fungal and bacterial microbiome composition in control and PE pregnancies, based on ITS and 16S sequencing. Beta diversity illustrated with principal coordinate analysis (PCoA) for fungal (a) and bacterial microbiota (b). Vectors indicate increasing BMI and gestational age. (c) The two bar plots quantitatively depict how BMI and gestational age influence the differences between the two groups BMI+ and BMI-, separated in the PCoA plot for fungal microbiota (a). C: control, PE: preeclampsia, l.o: lacto-ovo vegetarian, omn: omnivorous, veg: vegan diet. t-test for significance. * p = 0.0361.

