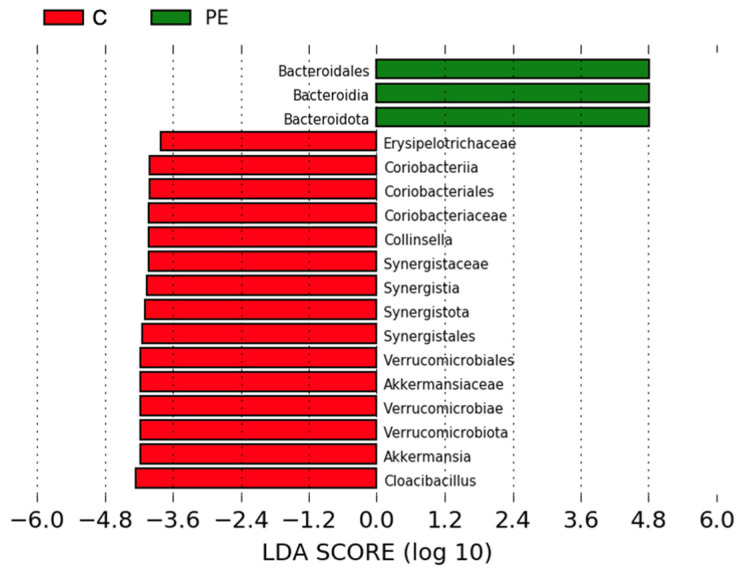
Figure 4.
Linear discriminant analysis effect size (LEfSe) analysis showing significantly differential relative abundances of bacteria in control and PE pregnancies at all taxonomic levels. LDA score threshold = 3. Green = higher in PE, red = higher in controls. Results with p values < 0.05 were considered significant and are shown in the figure.

