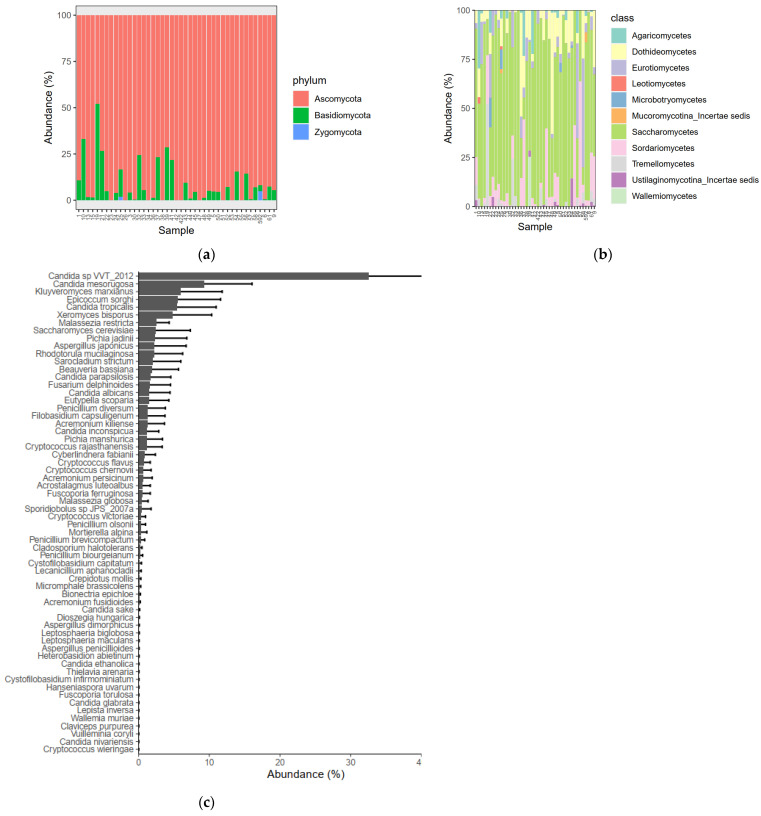
Figure 5.
Bar and stacked bar plots showing relative percentage abundances of mycobiome taxonomic bins in ITS gene sequence datasets: the phylum (a) and class levels (b) are shown individually, while the species level is shown as means across the cohort (c). The most abundant fungal species are displayed. Cutoff for taxon inclusion = 0.01%.

