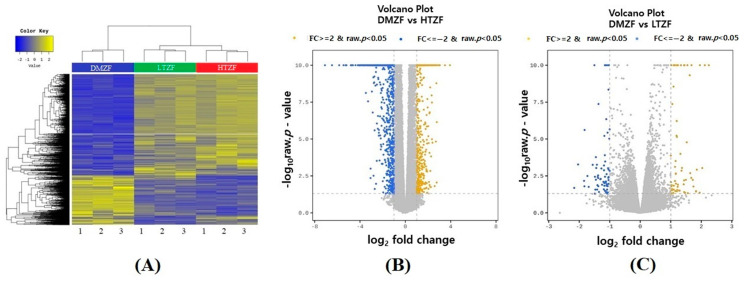
Figure 5.
(A) Heat map of differential expression between DMZF, LTZF, and HTZF. Two-way hierarchical clustering heat map using the z-score for normalized values (log2-based). (B) Volcano plot of dimethylsulfoxide-treated zebrafish (DMZF) vs. 4.0 µg/L thiram-treated fish (HTZF). (C) Volcano plot of DMZF vs. 0.4 µg/L thiram-treated zebrafish (LTZF). Each blue colored dot indicates a downregulated gene (FDR < 0.05 and FC ≤ −2), and each yellow dot indicates an upregulated gene (FDR < 0.05 and FC ≥ 2).

