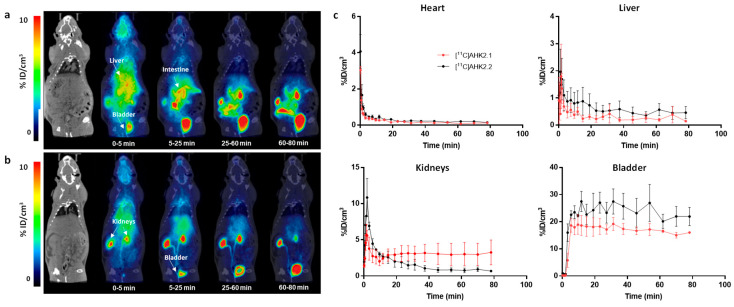
Figure 6.
Biodistribution of [11C]AHK2.1 (a) and [11C]AHK2.2 (b) after intravenous administration (dose = 1 μg/Kg). Representative whole body coronal PET images (projections) obtained at different time points after administration. PET images have been co-registered with a representative CT slice for the anatomical localization of the radioactive signal. Positions of the major organs are indicated. Scale bar in in Standard Uptake Value (SUV) units; (c) concentration of radioactivity in the different organs as determined from PET images after intravenous administration of [11C]AHK2.1 and [11C]AHK2.2. Values are expressed as %ID/cm3. Values correspond to mean ± standard deviation, n = 3 per radiolabelled compound.

