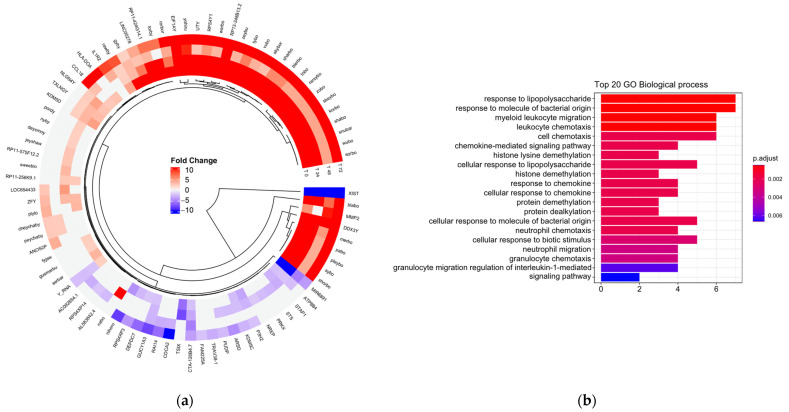
Figure 1.
(a) Circular heat map representation of unsupervised hierarchical clustering from analysis of different time (rows) grouped by gene (columns). The red tones indicate upregulation and blue tones, downregulation. (b) Gene ontology (GO) enrichment between men and women. Top 20 significantly enriched GO. p.adjust (adjusted p-value): Red < purple < blue. Graphs were plotted using Database for Annotation, Visualization, and Integrated Discovery (DAVID) online tool version 6.8.

