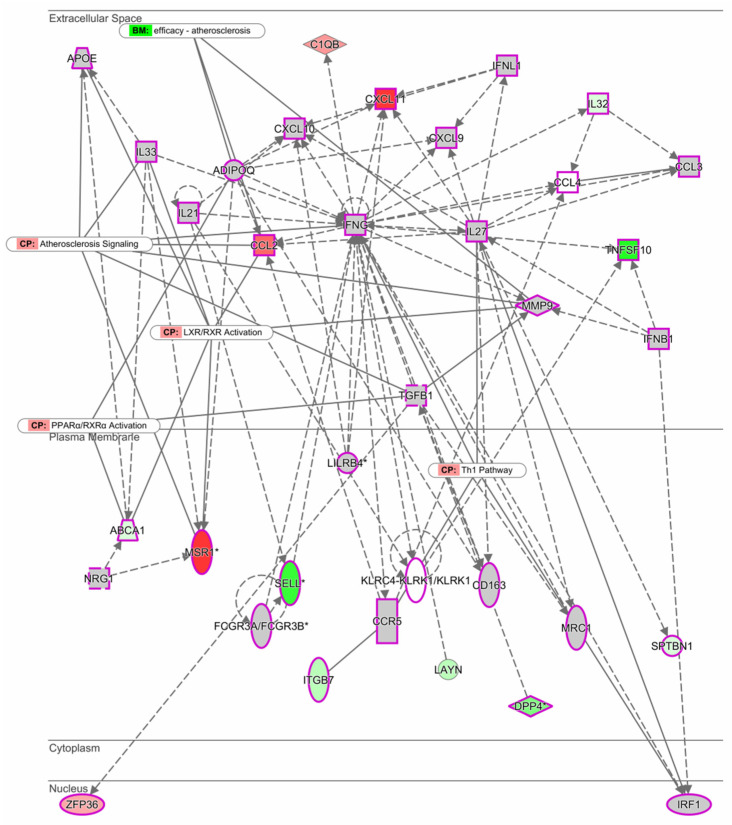
Figure 2.
Expression network between men and women. The intensity of the node color-(red) indicated the degree of up-regulation. Genes in uncolored notes were not identified as differentially expressed in our experiment and were integrated into the computationally generated networks based on the evidence stored in the Ingenuity Pathway Analysis (IPA software, QIAGEN). The node shapes denote enzymes (♦), G-protein coupled receptor (▯), transmembrane receptor (0), cytokines (□), growth factor (⬚), transporter ( ), and other (◯). Graphs were plotted using IPA software by QIAGEN.

