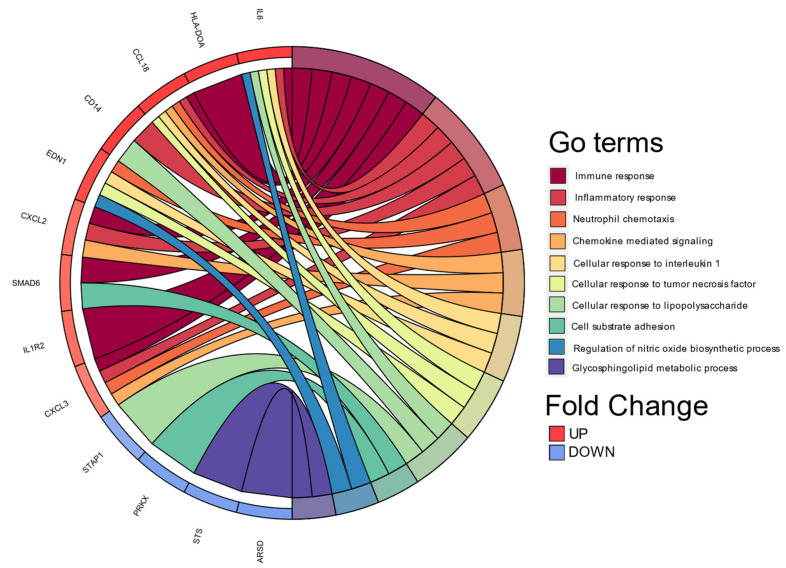
Figure 3.
Chord plot of the top 10 Gene Ontology (GO) terms. In each chord diagram, genes contributing to their respective enrichment are shown on the left, and enriched GO clusters are shown on the right. Downregulated mRNAs are displayed in blue, whereas upregulated mRNAs are displayed in red. Each GO term is represented by one colored line. Graph was plotted using Database for Annotation, Visualization, and Integrated Discovery (DAVID) online tool version 6.8.

