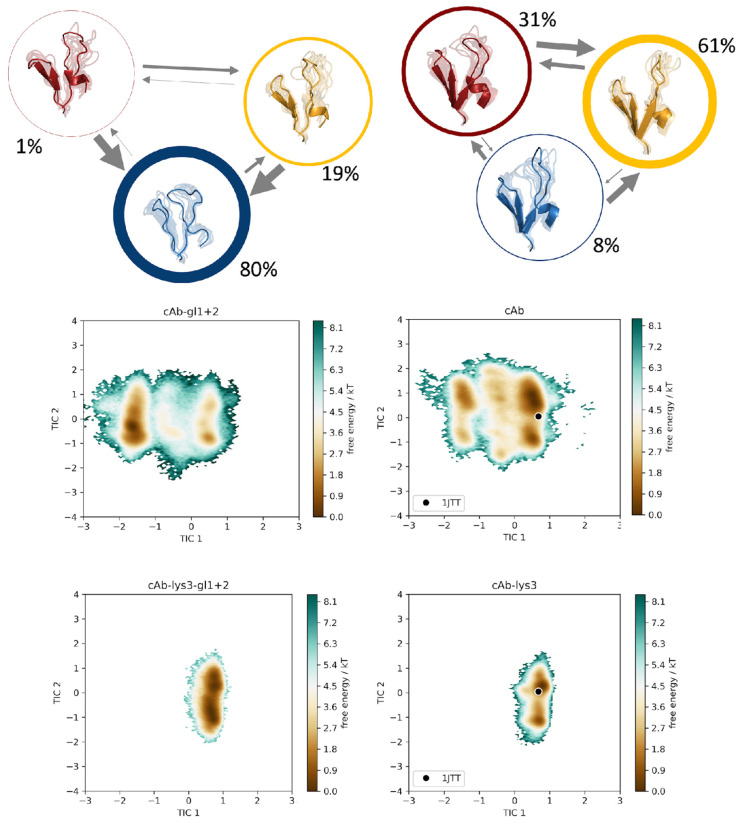
Figure 5.
Markov-state models for the germline variant cAb-gl1+2 and for the cAb variant. The simulations were performed without antigen present. The respective state probabilities are shown as percentages and reflected in the thickness of the respective circles. Faster transition timescales are represented as thicker arrows connecting the respective states. For each trajectory, the conformational tICA spaces are shown, projected into the same coordinate system together with the simulations of the bound structures (cAb-lys3-gl1+2 and cAb-lys3). The projection of the available crystal structure (PDB: 1JTT) is shown in the same coordinate system.

