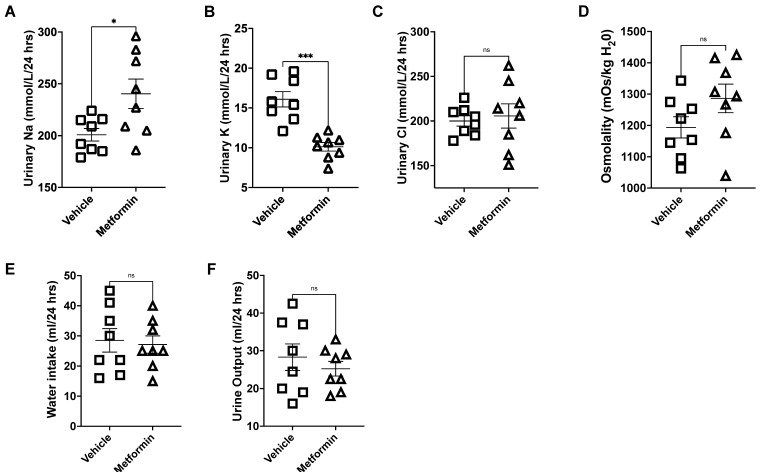
Figure 2.
Analysis of urinary sodium, potassium, chloride, osmolality, water intake, and urine output from vehicle- or metformin-treated db/db mice maintained on an HSD. (A) Urinary sodium (mmol/L/24 h); (B) urinary potassium (mmol/L/24 h); (C) urinary chloride (mmol/L/24 h); (D) urinary osmolality (mOsm/Kg H20); (E) water intake (ml/24 h); (F) urine output (ml/24 h). N = 8. Data are plotted as mean ± SEM, * represents a p-value < 0.05, and *** represents a p-value < 0.001. ns: not significant.

