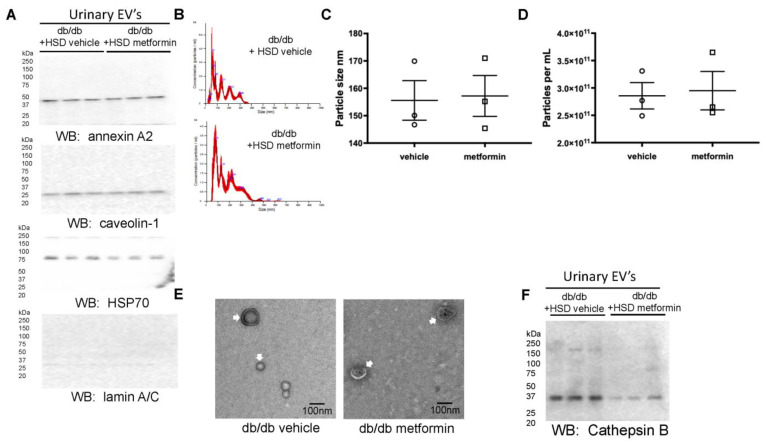
Figure 6.
Characterization of urinary EVs from vehicle- or metformin-treated db/db mice on an HSD. (A) Western blot for the presence of the EV markers annexin A2, caveolin-1, HSP-70, and the absence of the non-EV protein lamin A/C. (B) Nanoparticle tracking analysis showing EV peak profiles from diabetic db/db mice maintained on an HSD and treated with vehicle or metformin. (C) Summary plot showing EV size in nanometers (nm) in each group. (D) Summary plot showing EV concentration in particles/mL in each group (E) Transmission electron microscope micrographs of pooled EVs from each group showing the absence of aggregated proteins and the presence of EVs less than 200 nm in diameter. (F) Western blot depicting the enrichment of cathepsin B in urinary EVs from each group. N = 3 EV preparations per group.

