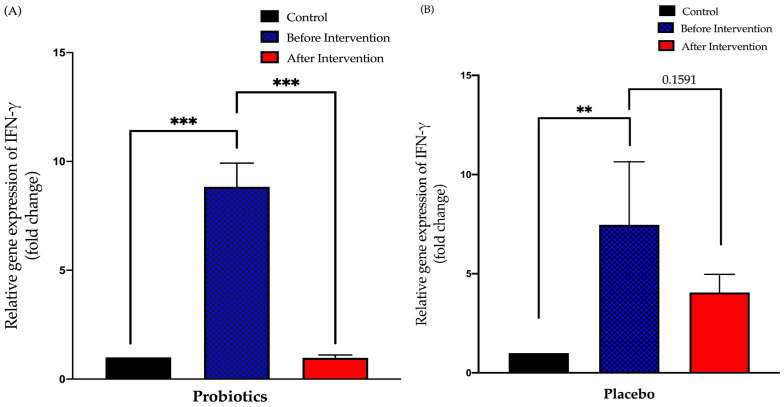
Figure 5.
Bar graph showing the relative expression of the IFN-γ gene (fold change) in the duodenal tissue of NAFLD patients. (A) Relative expression of IFN-γ gene (fold change) in the probiotics group; (B) relative expression of IFN-γ gene (fold change) in the placebo group. Values are expressed as mean ± SEM (** p < 0.01 and *** p < 0.0001). The probiotics group showed a significant decrease compared to before the intervention while the placebo group did not show any significant change after six months.

