Figure 5.
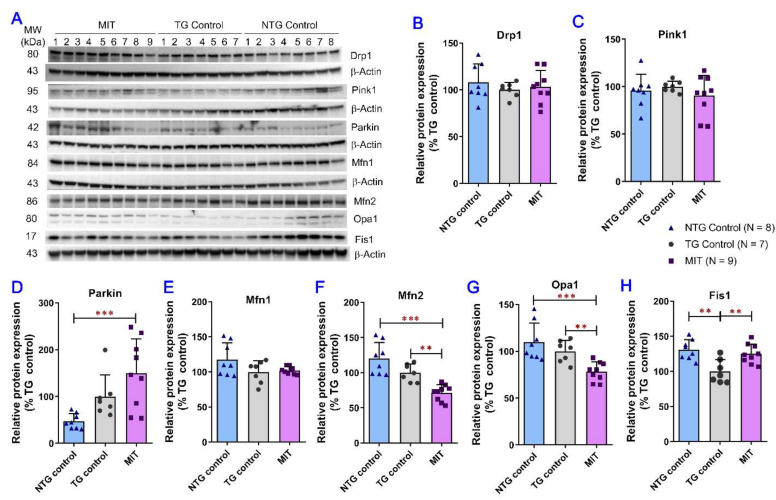
Evaluation of the MIT effect on mitochondrial fission/fusion events and mitophagy in the brain using the semi-quantitative Western blot analysis. The brain tissue samples were collected from the TG and NTG vehicle-treated control mice and the MIT-treated TG mice after the 3-month intranasal treatment. (A) Representative immunoblots showing the expression of Drp1, Pink1, Parkin, Mfn1, Mfn2, Opa1 and Fis1 in brain tissues collected from individual mice. Densitometric analysis of the relative expression of (B) Drp1, (C) Pink1, (D) Parkin, (E) Mfn1, (F) Mfn2, (G) Opa1, and (H) Fis1 proteins in brain tissues obtained from different study groups. The mean expression levels of Mfn2, Opa1, and Fis1 proteins in the brain tissues of MIT-treated APP/PS1 mice were significantly lower than those in the TG control mice (p < 0.01 for all). The data are expressed as mean ± SD (N = 8 for the NTG control group, N = 7 for the TG control group, and N = 9 for the TG MIT treatment group). SD is denoted by error bars. ** p < 0.01, and *** p < 0.001 were compared between the NTG control mice, TG control mice, and MIT-treated TG mice using a one-way ANOVA followed by a Tukey’s post hoc multiple comparison test.

