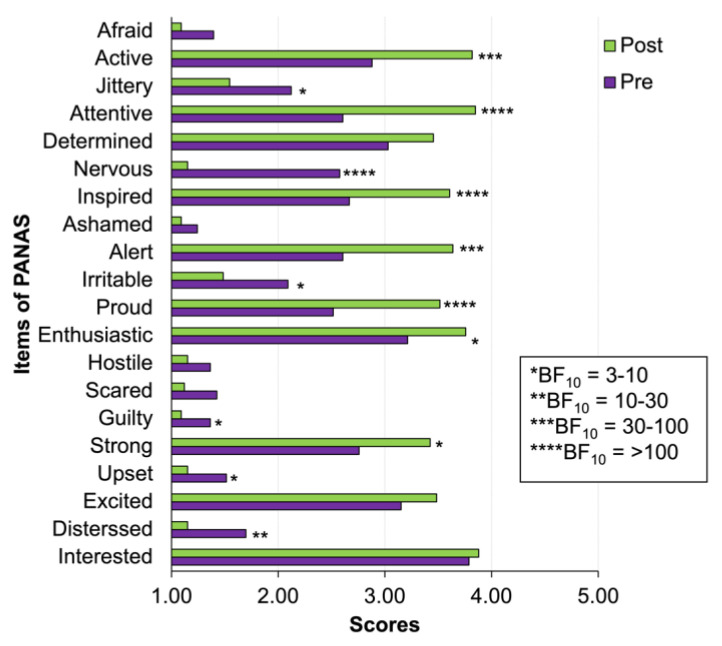
Figure 3.
Clustered bar plot of individual items of PANAS (see details of Wilcoxon’s signed rank statistics and Bayes factor in Supplementary Materials Table S2). Stars indicate the value of the Bayes factor for the alternative hypothesis of the difference between pre-CWI and post-CWI scores.

