Figure 4.
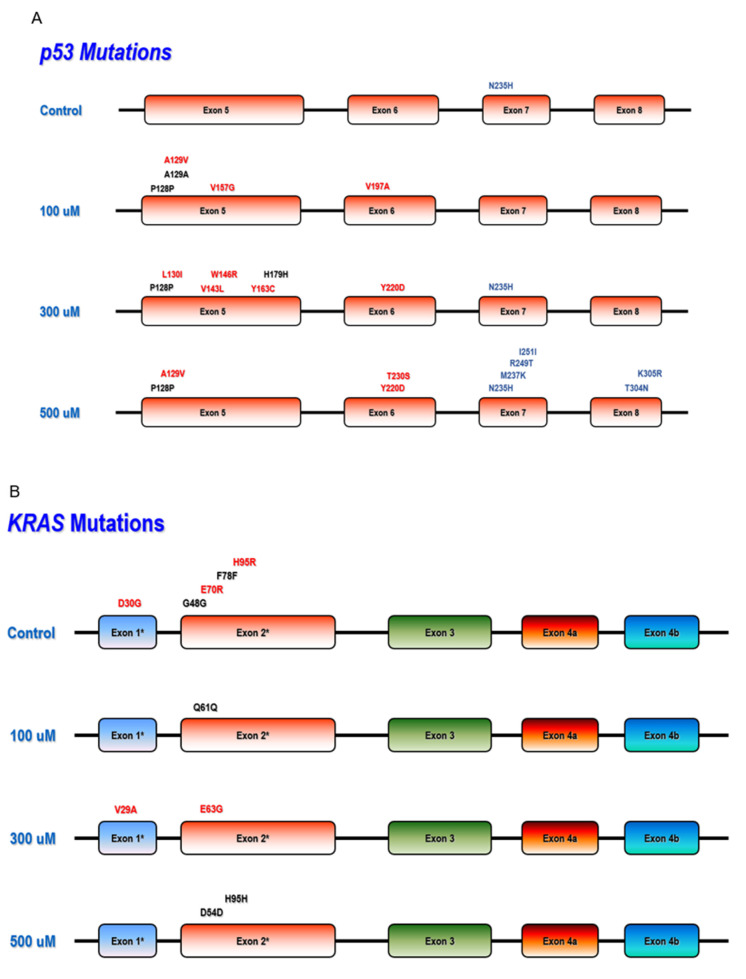
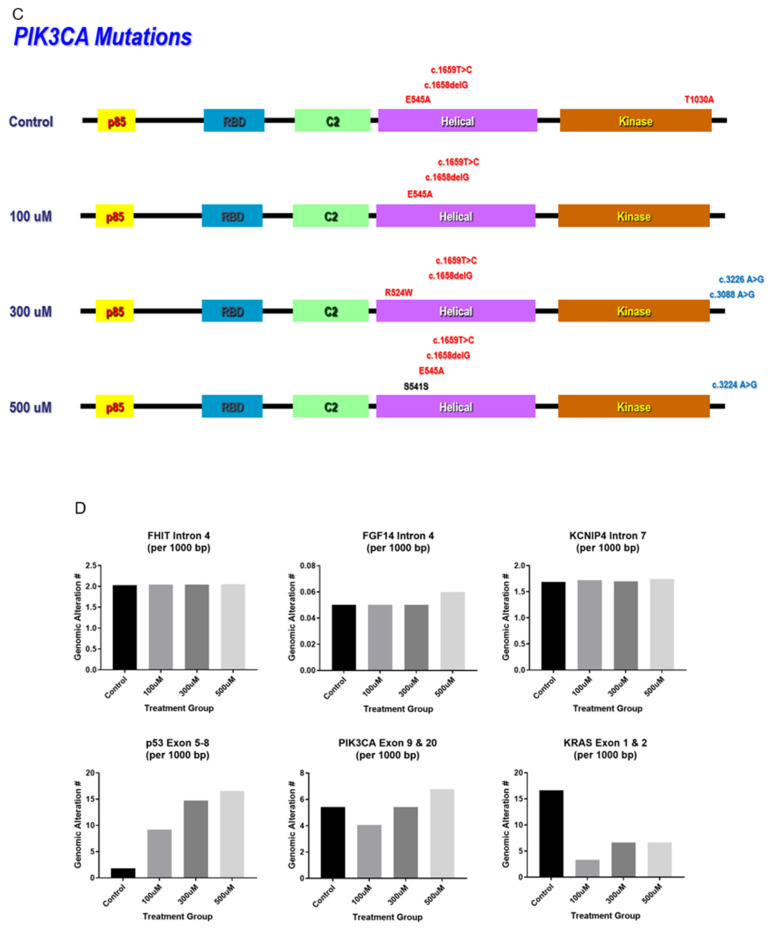
Mutation Hot Spots in TP53, KRAS and PIK3CA genes. Schematic diagrams of (A) TP53 (exons 5–8), (B) KRAS (exons 1 & 2, indicated with an asterisk), and (C) PIK3CA (exon 9 & 20) gene mutation hot spots. Specific mutations identified are shown on top of the gene for different treatment groups. Reported mutations are shown in black font; new mutations are shown in red font, substitution mutation in blue font. (D) Mutation Frequency Assessment. The bar charts represent trends of the total number of mutations per 1000 bp, hence no error-bar or statistical significance were provided.


