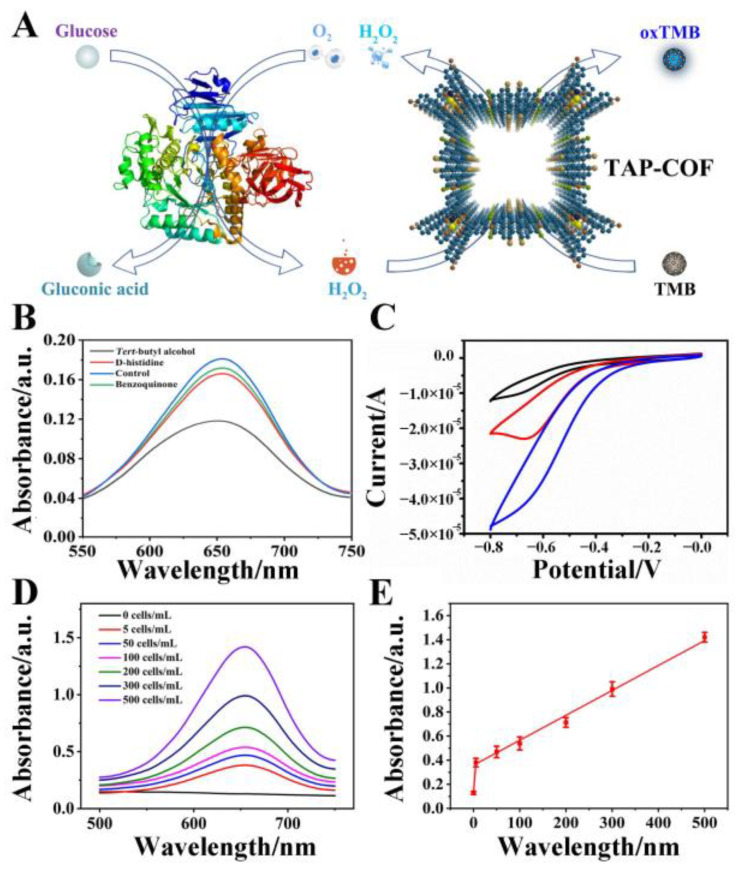
Figure 5.
(A) Diagrammatic representation of the blue-colored oxTMB produced in cells by the INAzyme-catalyzed cascade oxidation of glucose and TMB. (B) ROS trapping experiment. The TMB oxidation process in the presence of D-histidine (1O2 scavenger), tert-butyl alcohol (·OH scavenger), and benzoquinone (O2•− scavenger). (C) CV curves of different electrodes, GCE electrode (black line), FeTAPP/GCE (red line), TAP-COF/GCE (blue line). TAP-COF-based colorimetric examination of MCF-7 cells in binding buffer for quantitative analysis of (D) UV-vis absorption spectroscopy and (E) linear calibration of MCF-7 cells detection.

