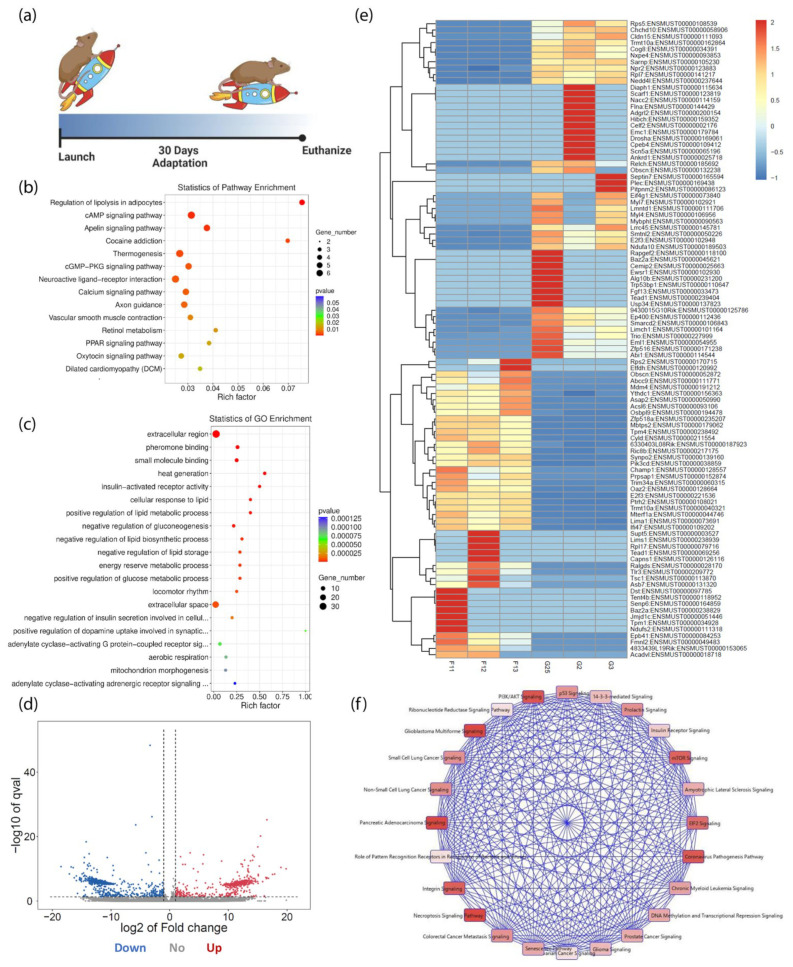
Figure 1.
Transcripts Affected by Spaceflight. (a) Experimental timeline of spaceflight mice; (b) KEGG-pathway-enrichment scatterplot; (c) Gene ontology (GO)-enrichment scatterplot; (d) Volcano plot of transcript expression in the spaceflight group; (e) Heatmap of transcript expression levels showing the top 100 transcripts (p < 0.05) in spaceflight (F11, F12, F13) and control groups (G25, G2, G3); (f) IPA-generated pathway map relating to the top 100 significant transcripts. Each canonical pathway is colored proportionally to the p-value of a right-tailed Fisher’s test. A more saturated red indicates greater significance.

