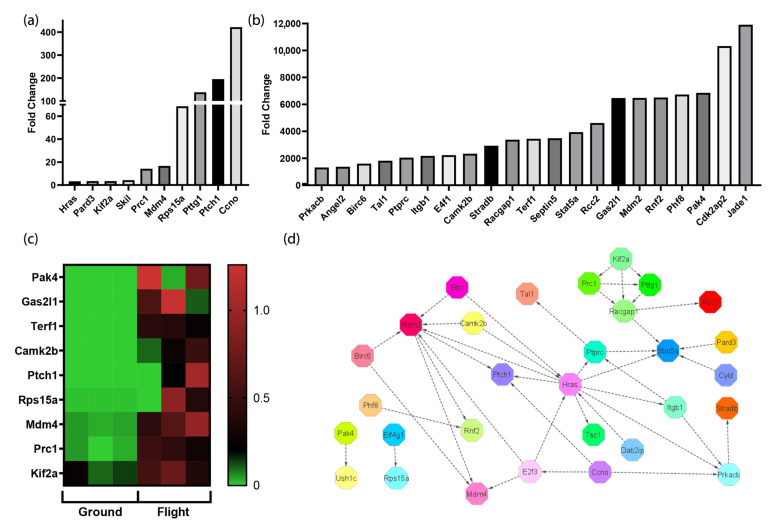
Figure 5.
Cell-cycle transcripts are upregulated in spaceflight. (a,b) Differential transcript expression analyses revealed a statistically significant elevation of targets associated with activation of the cell cycle in spaceflight mice (p value < 0.001). (c) Heatmap showing differential expression of transcripts associated with proliferation. These transcripts are listed in descending order of fold change (~6000 to 3 fold). (d) A protein–protein interaction network with data generated in String demonstrates connections between the transcripts identified in (a) and (b).

