Figure 3.
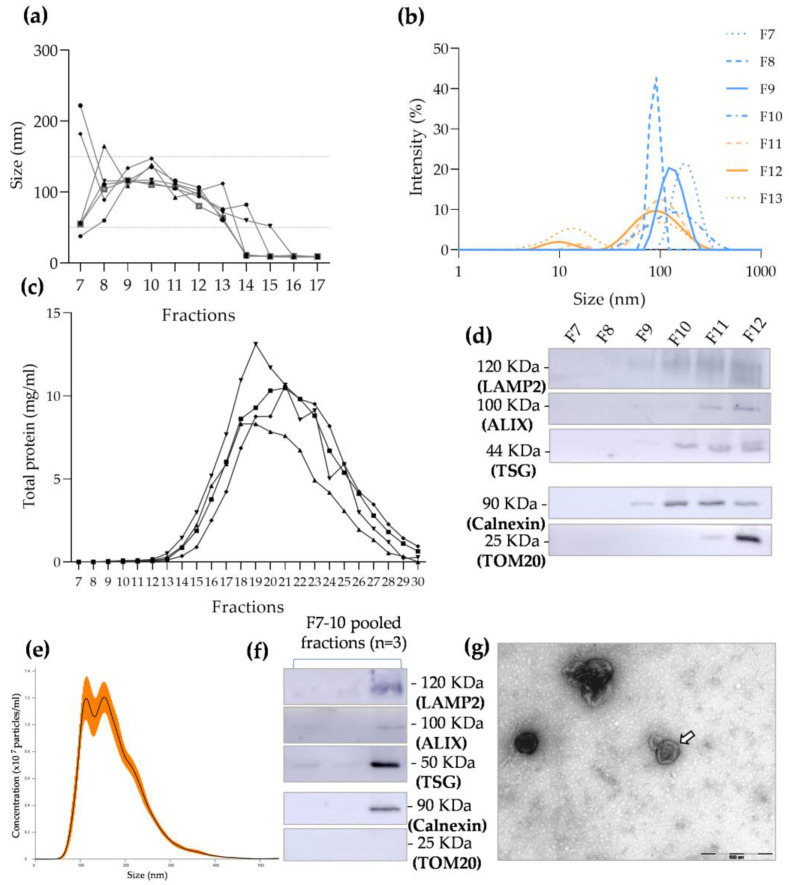
Characterization of total fractions and extracellular vesicle (EV)-enriched fractions obtained using size-exclusion chromatography (SEC): (a) dynamic light scattering (DLS) analysis of particle sizes in fractions 7 to 17, where the ranging size of small EVs (50–150 nm) is highlighted by the dotted line and values correspond to the highest-intensity population in each fraction; (b) DLS analysis of particle size distribution in fractions 7 to 13, where the orange lines represent fractions containing two differently sized peaks of intensity and the blue lines correspond to a one-intensity-peak EV population (n = 1); (c) graph demonstrating total protein quantification in fractions 7 to 30 (n = 4); (d) Western blot membrane showing the expression of specific EV positive markers, such as LAMP2 (fractions 9 to 12), ALIX (fractions 10 to 12), and TSG101 (fractions 9 to 12), and the presence of calnexin and TOM20 contamination in fractions 9 to 12 and fractions 11 to 12, respectively (see Supplementary materials for controls); (e) nanoparticle tracking analysis (NTA) of particle concentration and size distribution in EV-enriched fractions (F7–10), where the orange bars indicate ± SEM; (f) Western blot membrane showing the expression of specific EV positive markers (LAMP2, ALIX, and TSG101) and calnexin contamination in EV-enriched fractions, but no detectable presence of TOM20 (see Supplementary materials for controls); (g) representative transmission electron microscopy image of the EV-enriched fractions isolated using SEC (EV cup-like structure indicated by the arrow).

