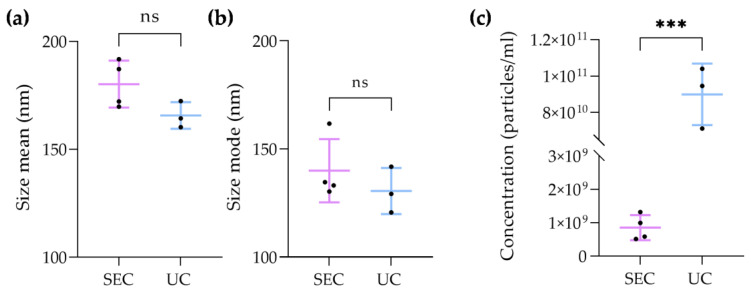
Figure 4.
Comparison of EV diameter size and mode, and particle concentration between ultracentrifugation (UC) and size-exclusion chromatography (SEC): (a) graph showing the comparison diameter mean of EVs obtained with UC (n = 3) and SEC (n = 4) (unpaired t-test); (b) graph demonstrating the comparison of EV diameter mode of EVs isolated with UC (n = 3) and SEC (n = 4) (Mann–Whitney test); (c) graph presenting the difference between the concentration of particles isolated with UC (n = 3) and SEC (n = 4) (unpaired t-test). p value > 0.05 equals not significant (ns), and p ≤ 0.0001 ***.

