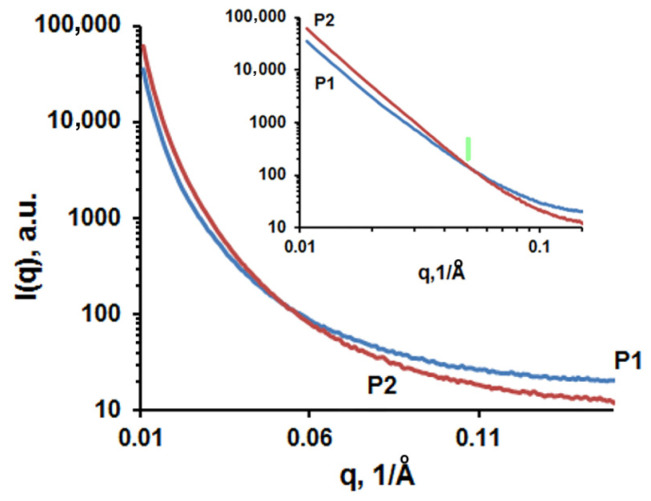
Figure 6.
The scattering curves I(q) (log-norm plot) for samples obtained from W/A (P1—sample 13, Table S3) and DMF (P2—sample 7, Table S1), and inset—the logarithmic plot of the scattering curves. The green arrow indicates the end of the linear region corresponding to the same q value for both samples.

